Multi Agent Operating System
for SRE and DevOps
Unify your tools, automate incident response, and let AI agents handle reliability at scale without the noise, context switching, or delays.
Unify your tools, automate incident response, and let AI agents handle reliability at scale without the noise, context switching, or delays.
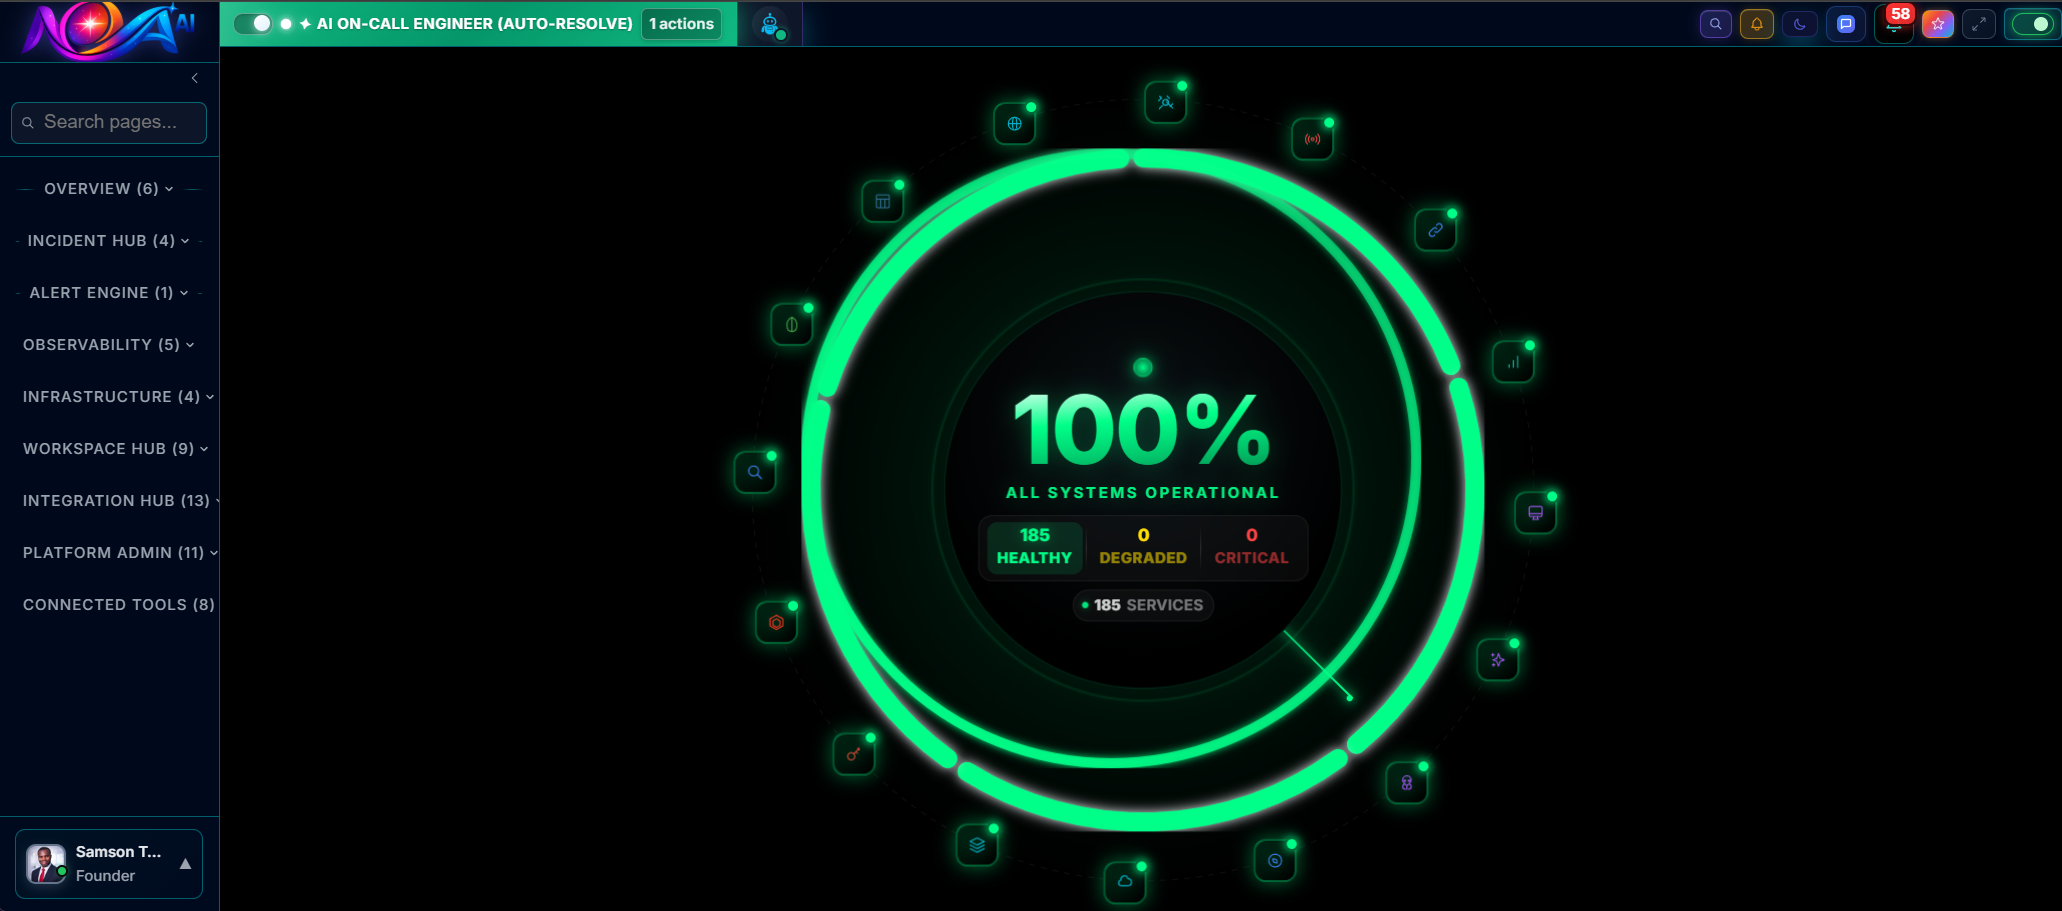
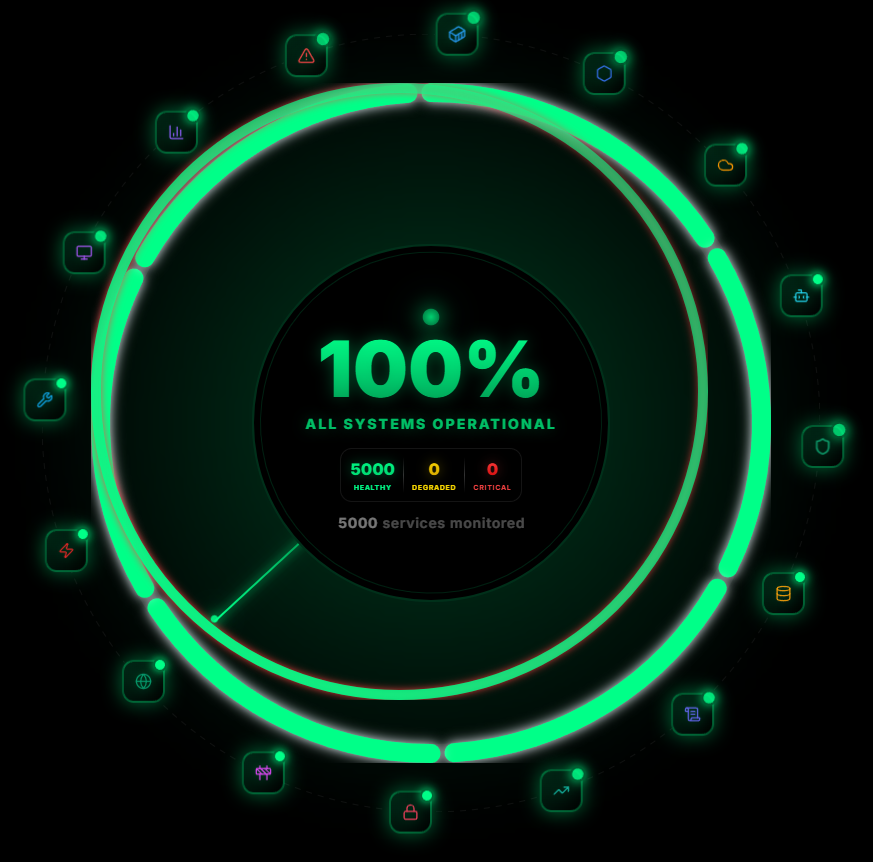
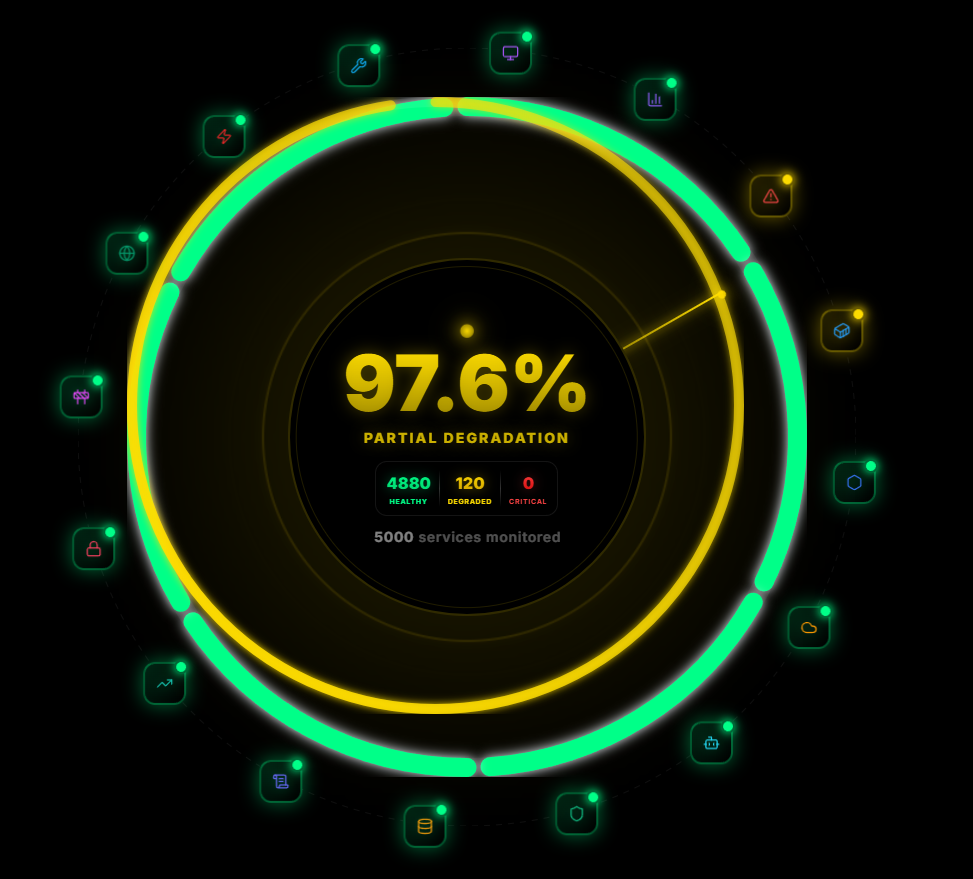
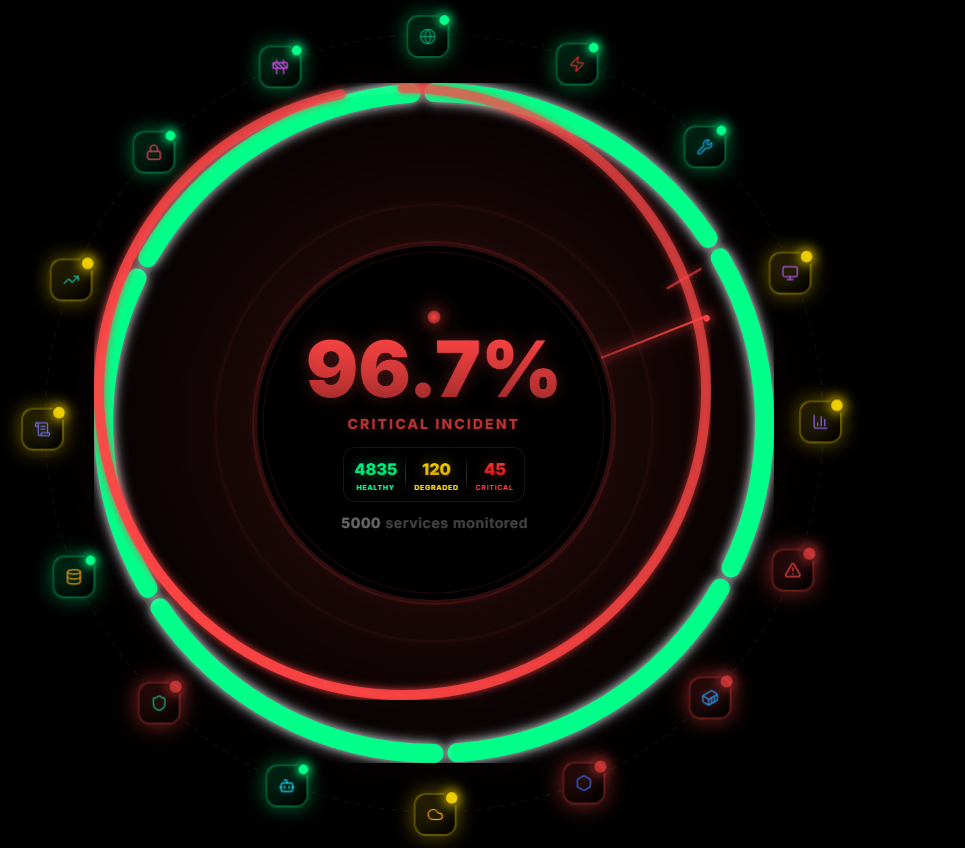
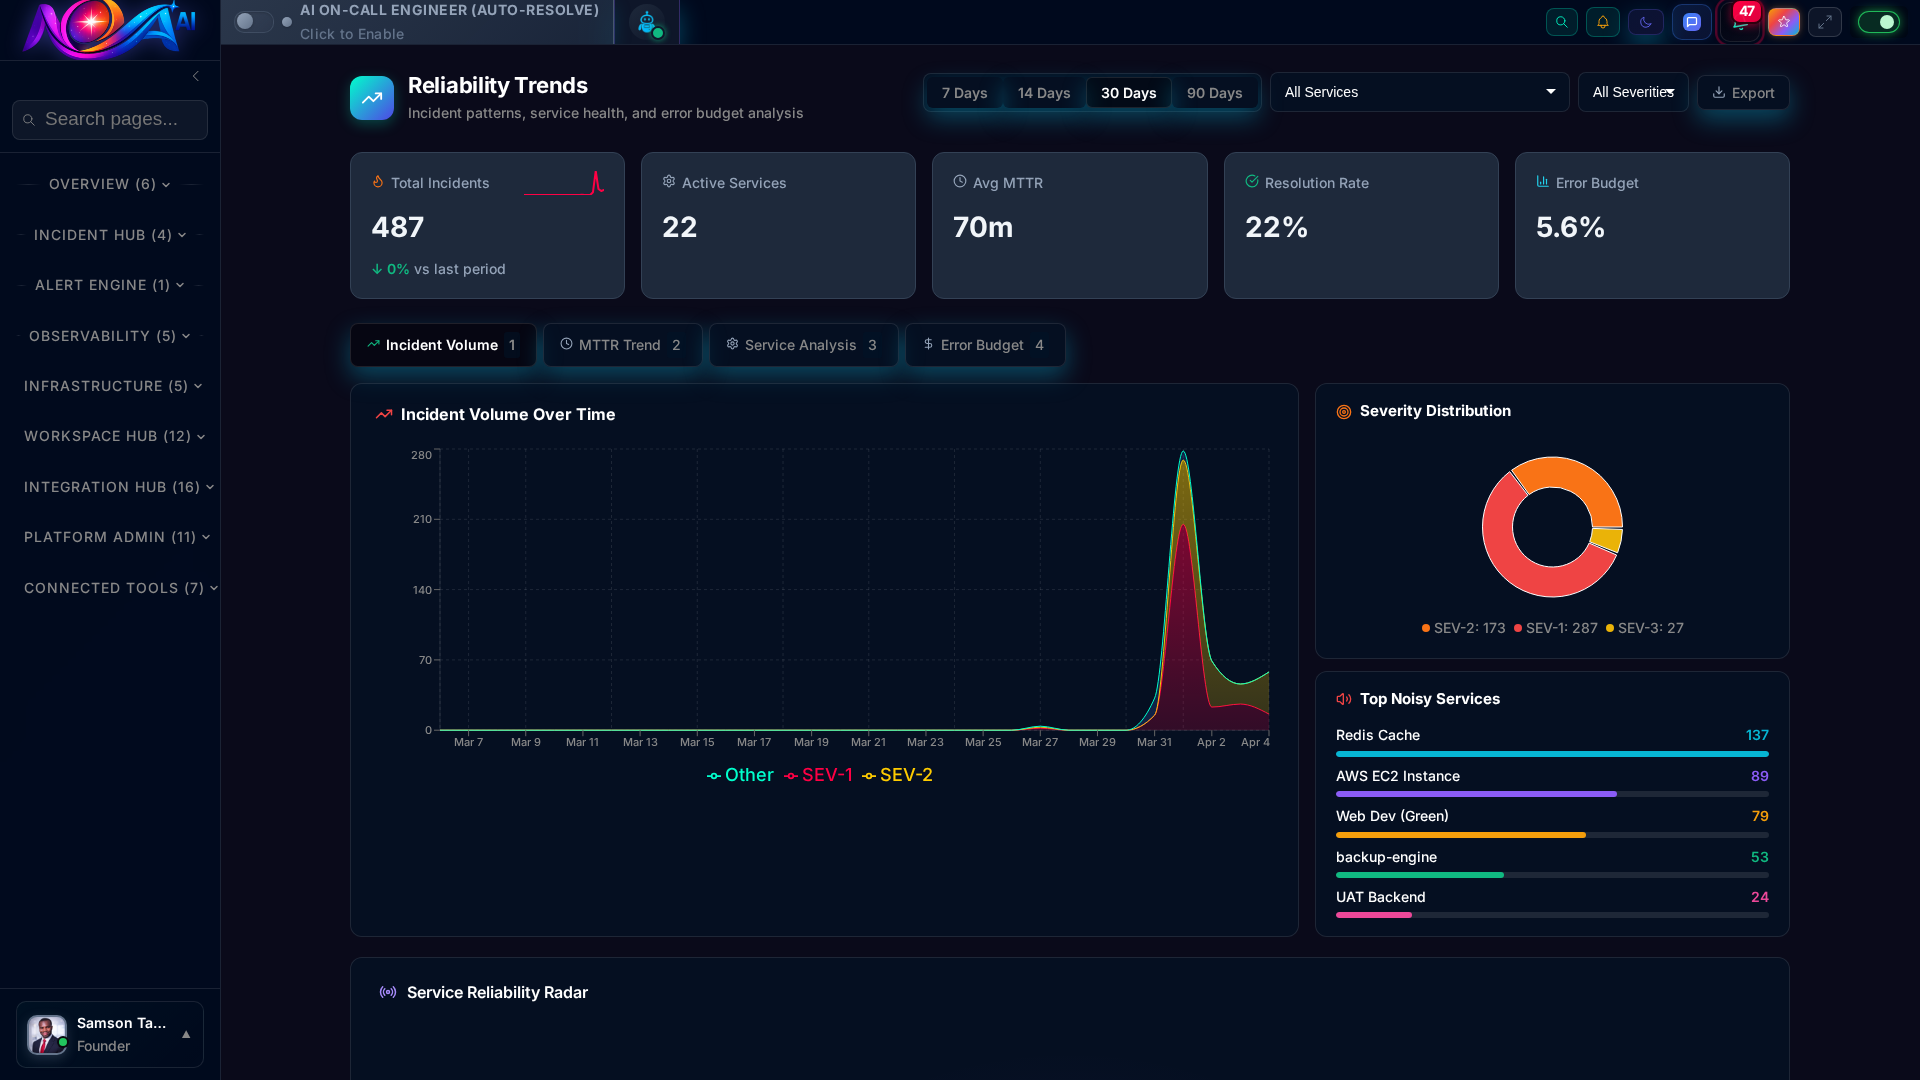
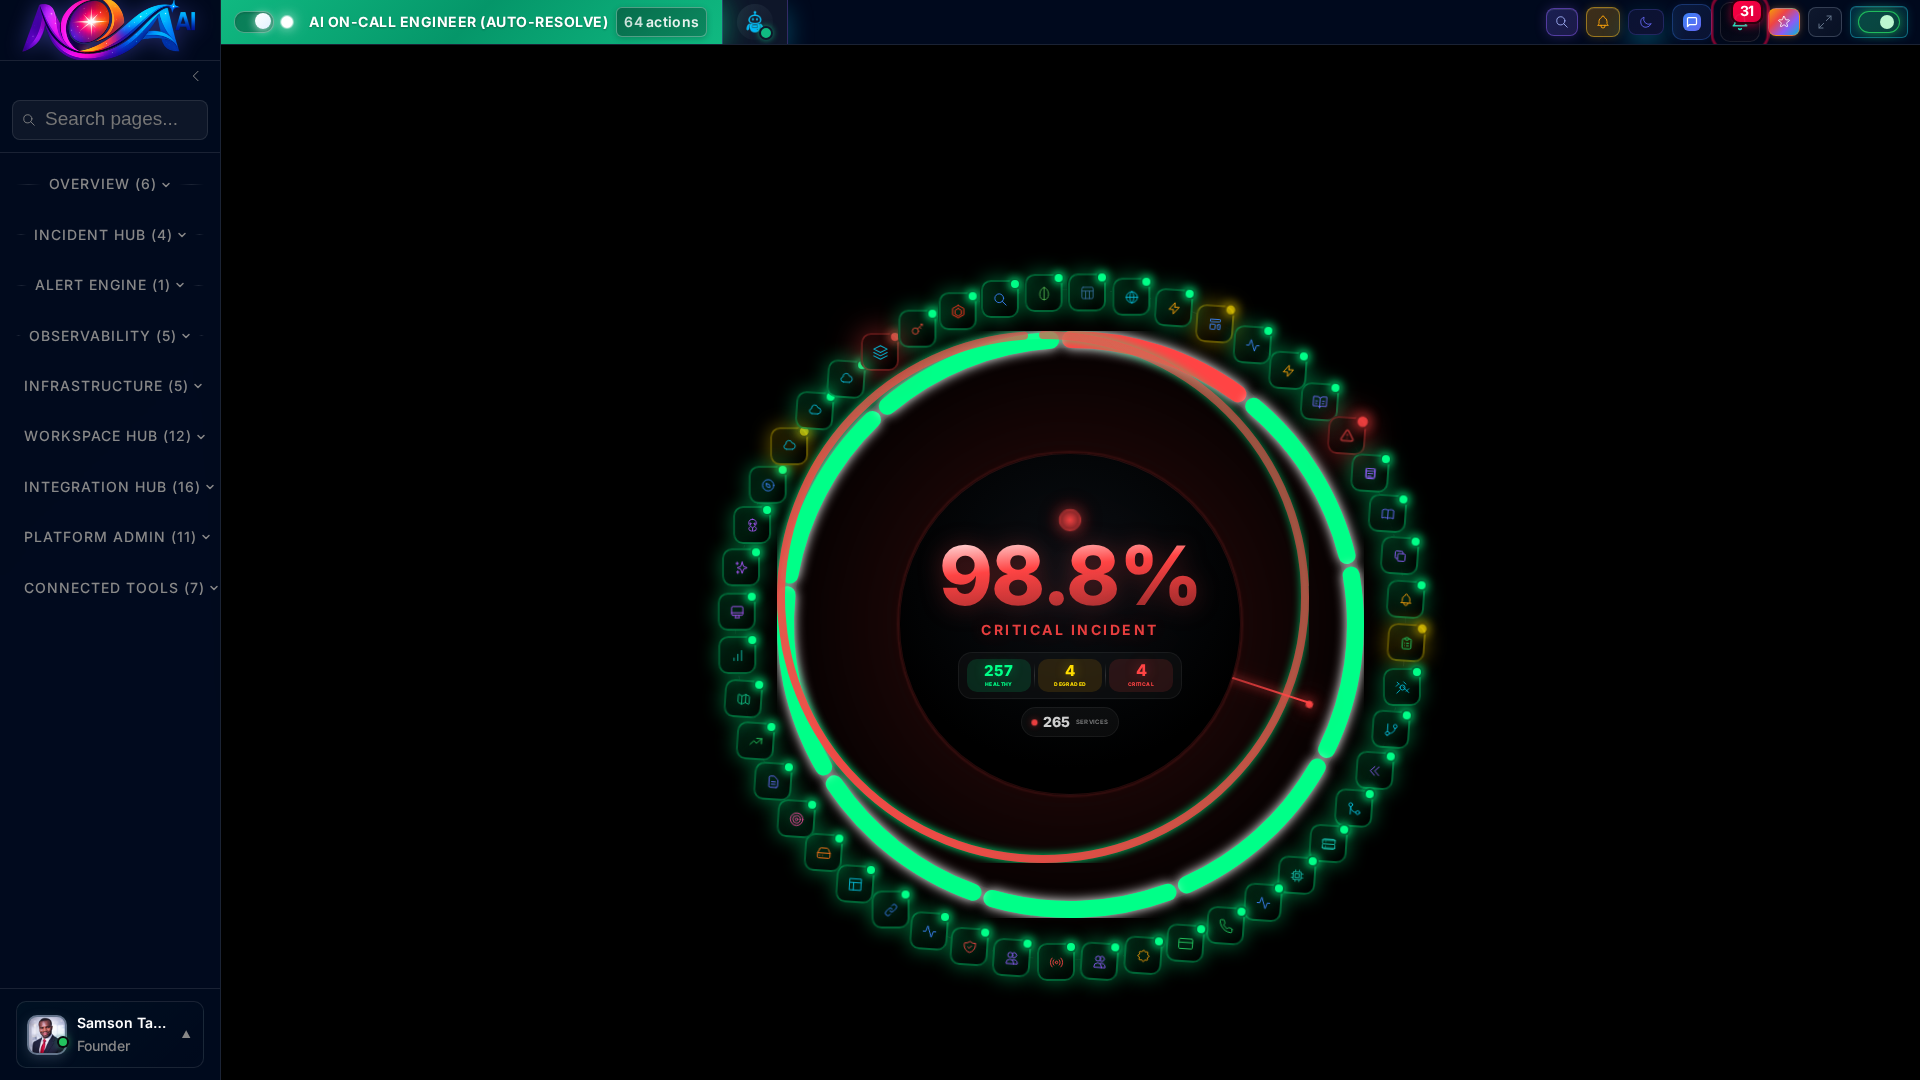
Stop monitoring thousands of services across dozens of tools. Nova AI distills your entire infrastructure health into a single, color-coded status — so you always know where you stand in under one second.
A single platform replacing Datadog, PagerDuty, Grafana, and 12 more tools. Built for teams who refuse to accept 3am pages as normal.
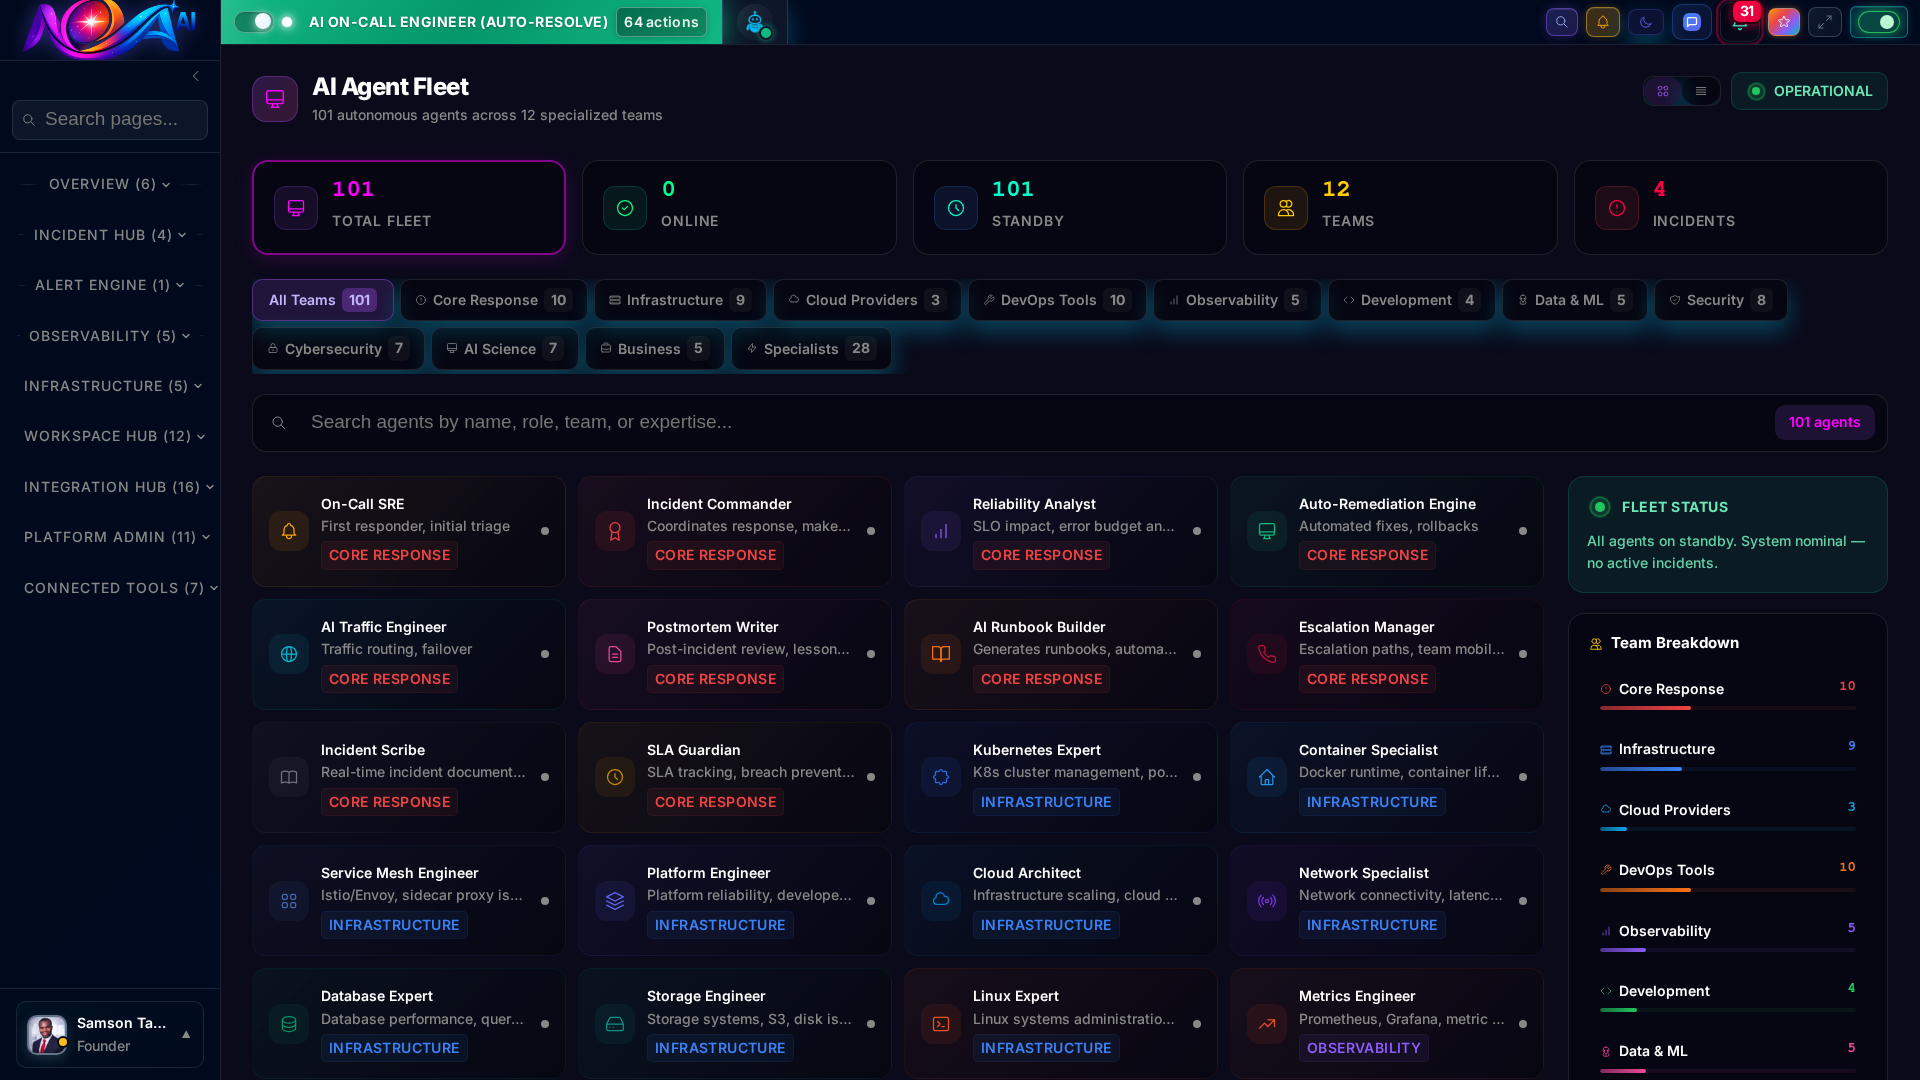
From Core Response to Security, each AI agent is a domain expert that works 24/7. They don't take vacations, don't get paged at 3am, and never miss a pattern.
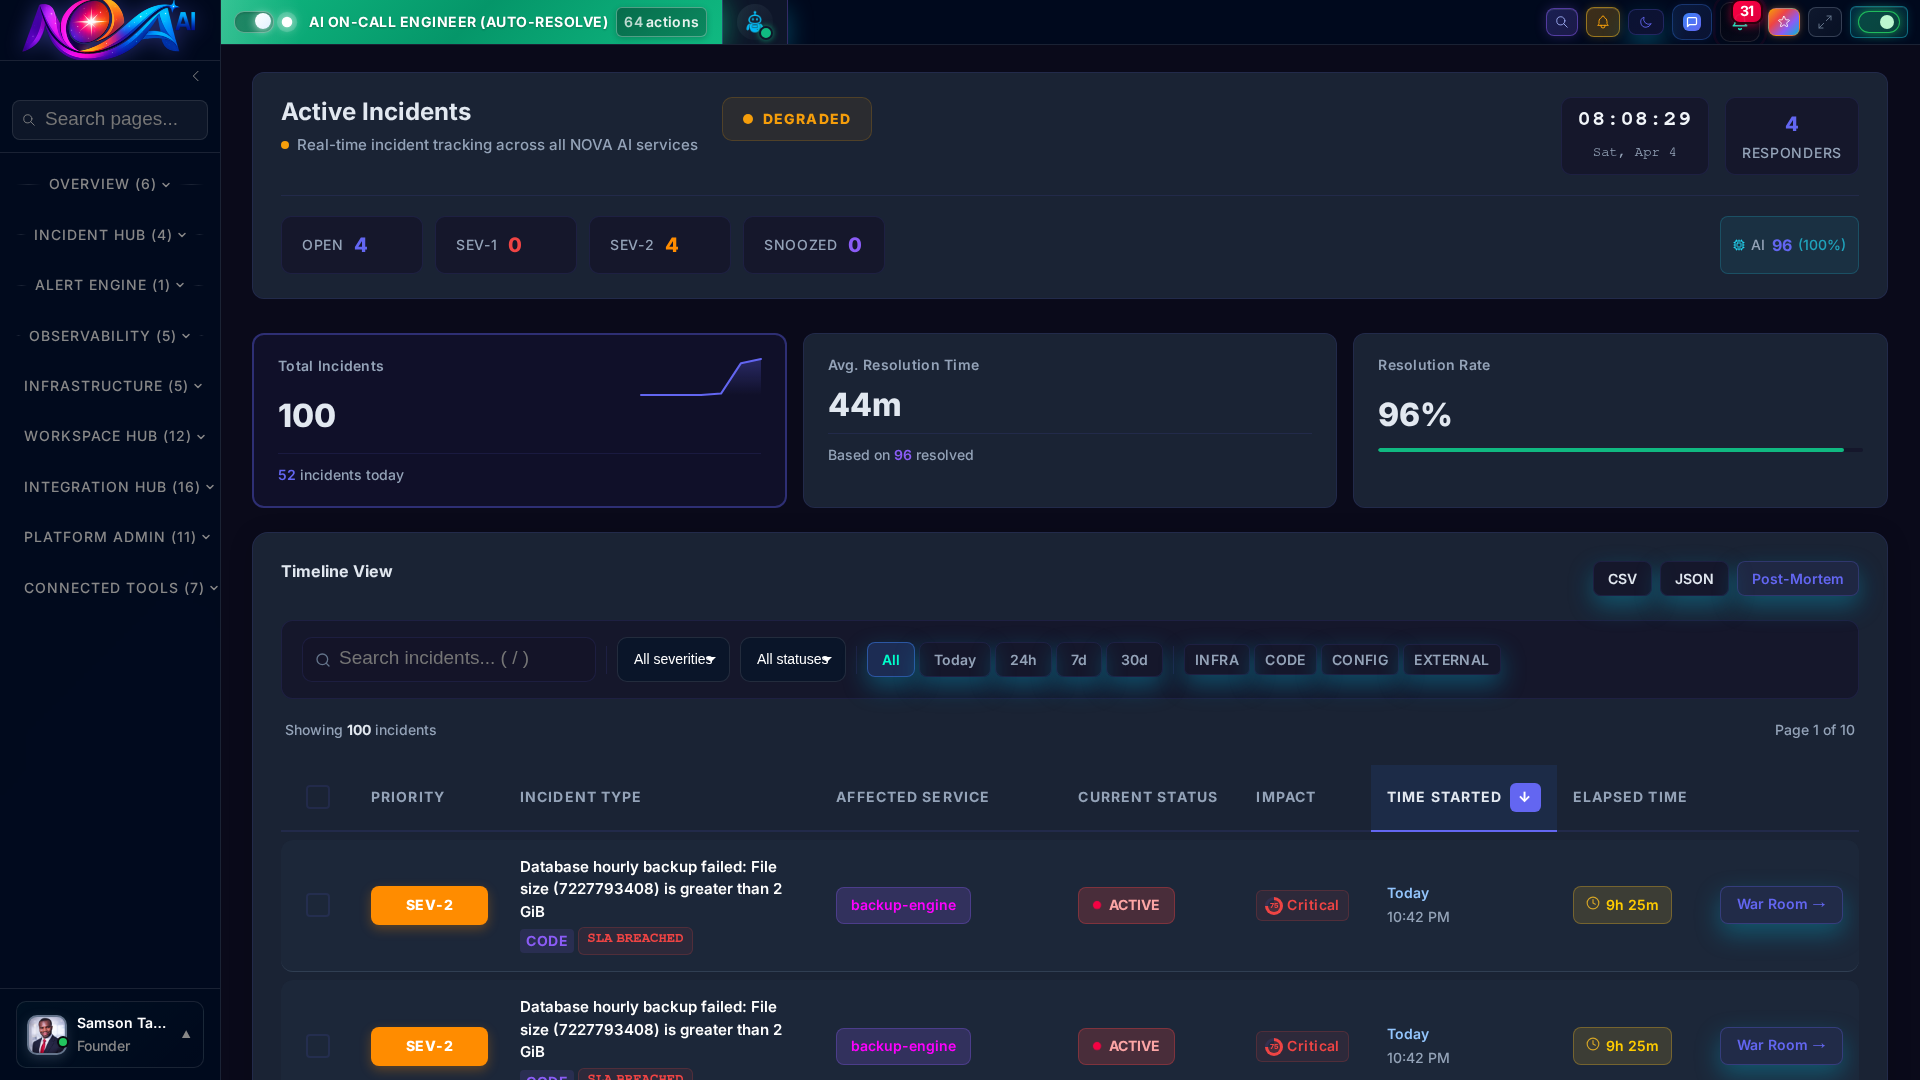
AI-powered anomaly detection catches issues before customers report them. Smart severity scoring, blast radius analysis, and automated lifecycle management.
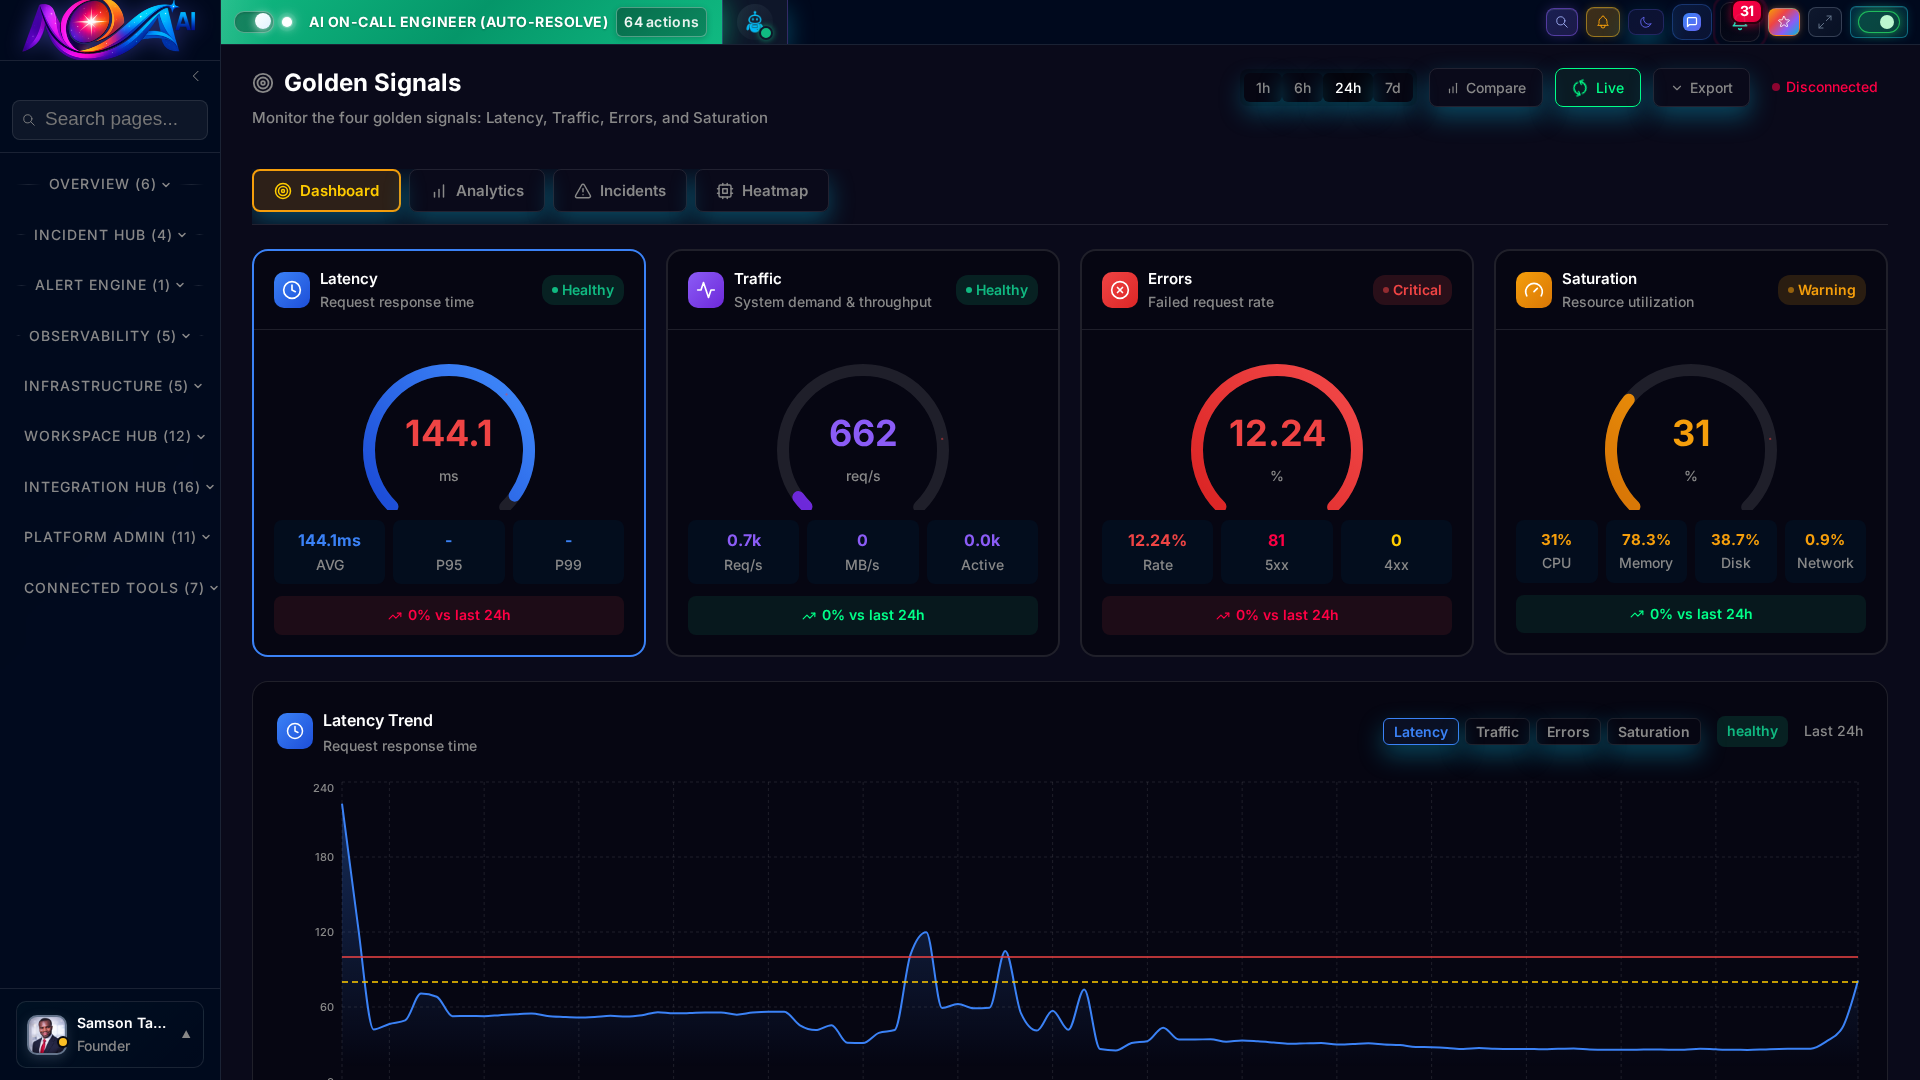
The four pillars of SRE observability in one view. Real-time gauges for Latency, Traffic, Errors, and Saturation with trend analysis and anomaly detection.
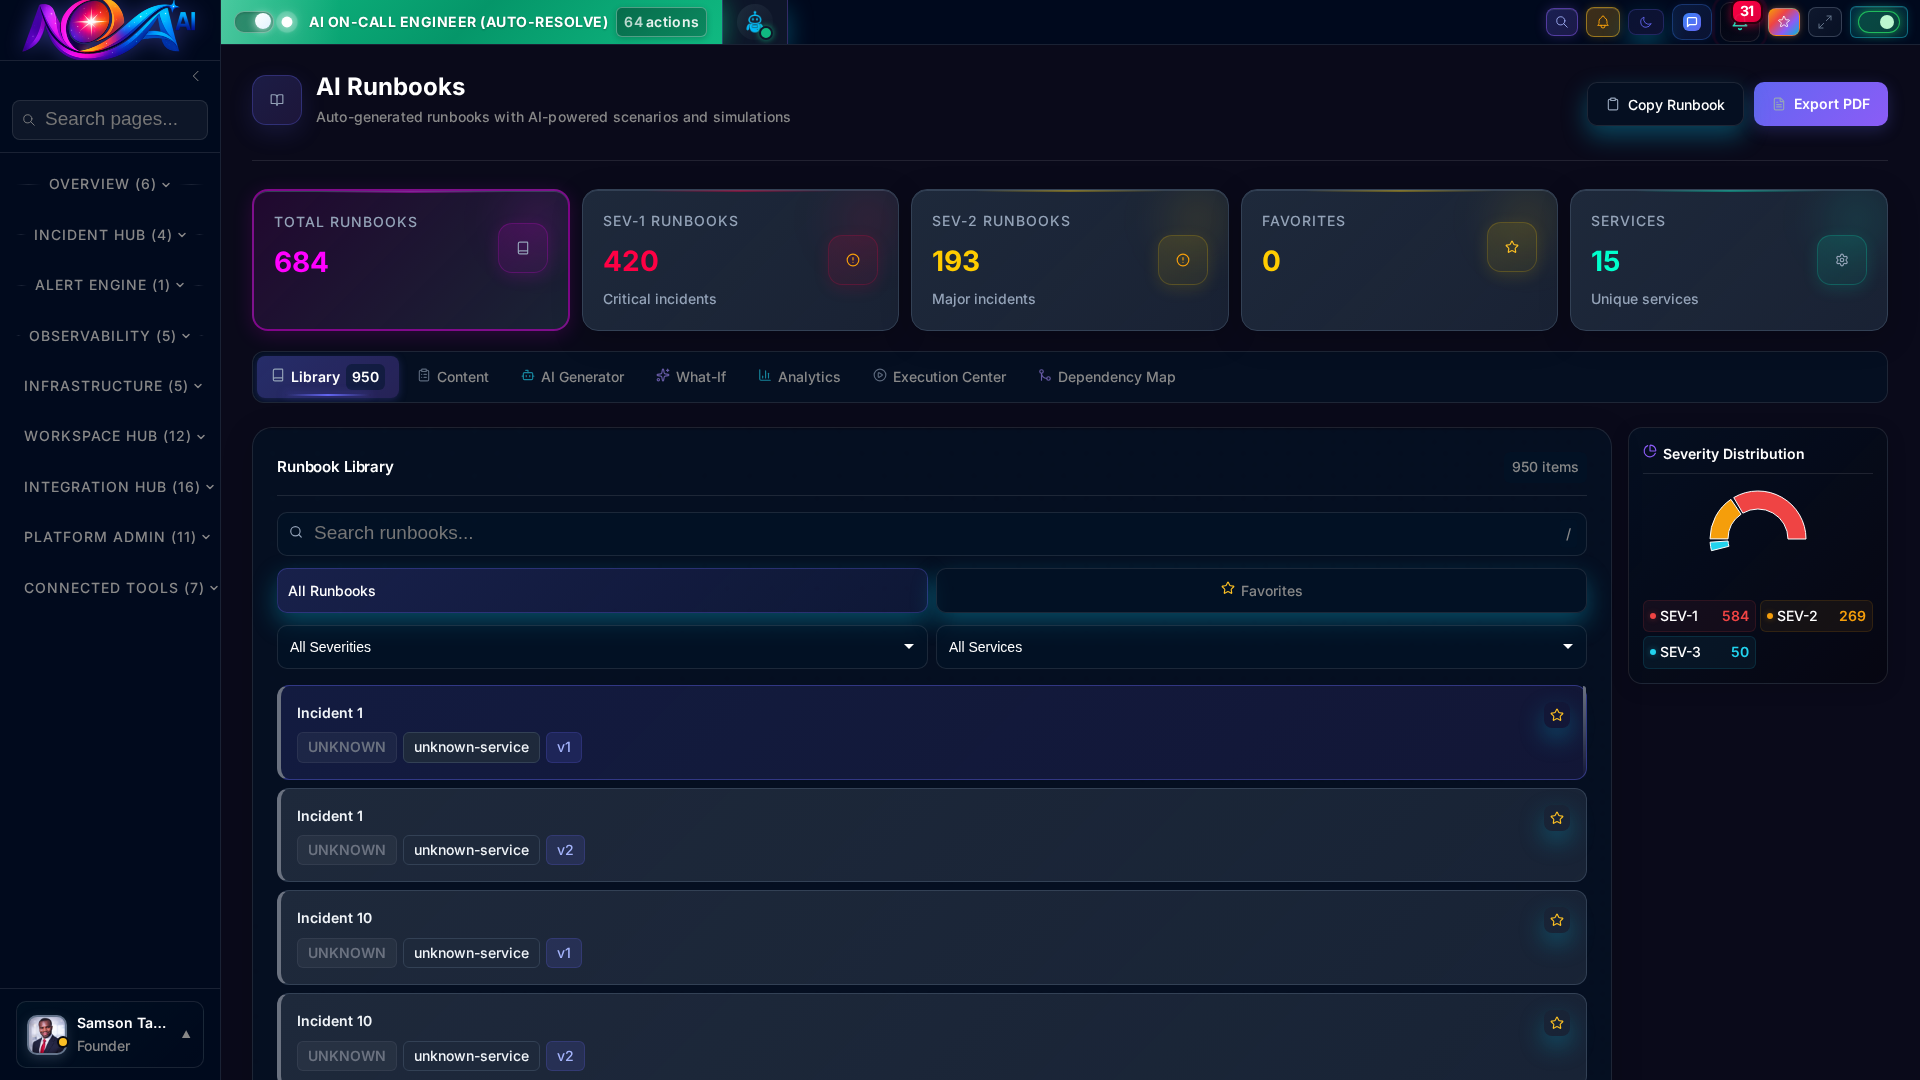
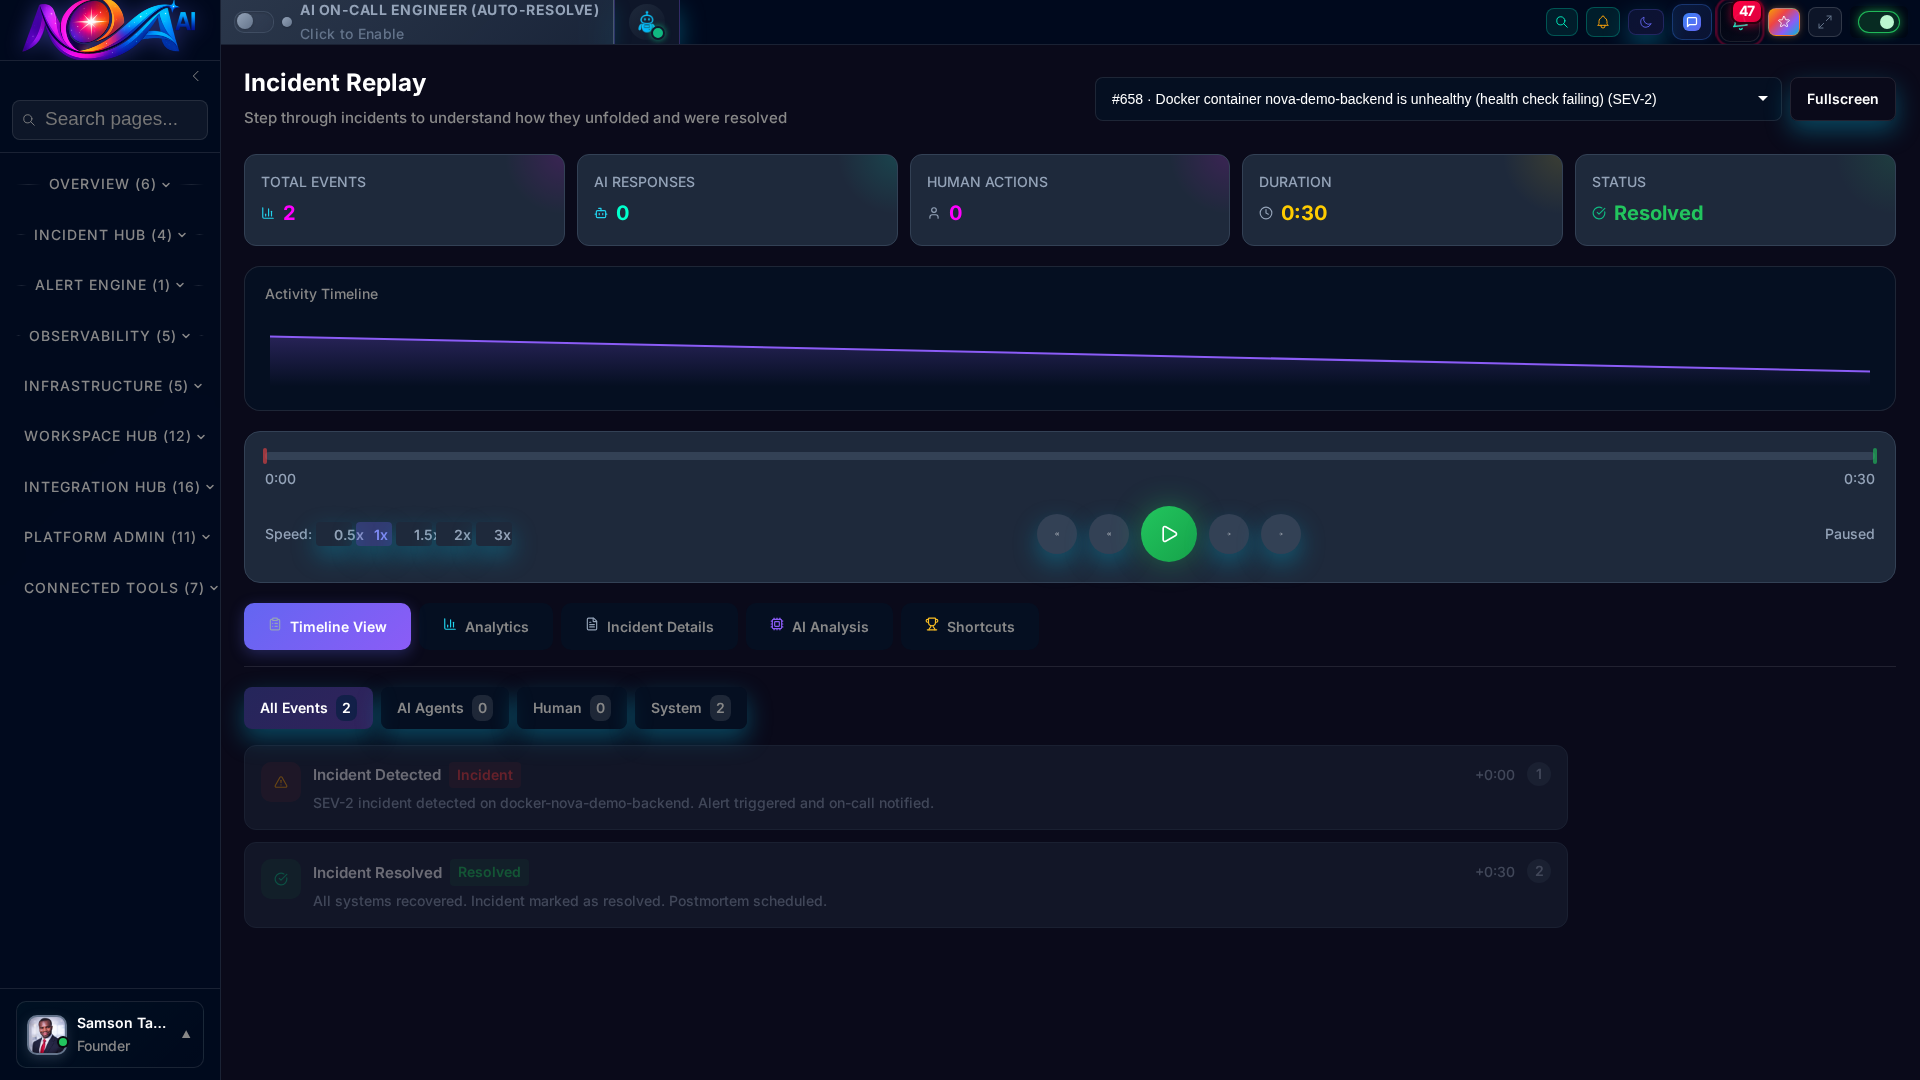
AI learns from your incident history and auto-generates executable runbooks. What-if scenario simulation lets you rehearse SEV-1 responses before they happen.
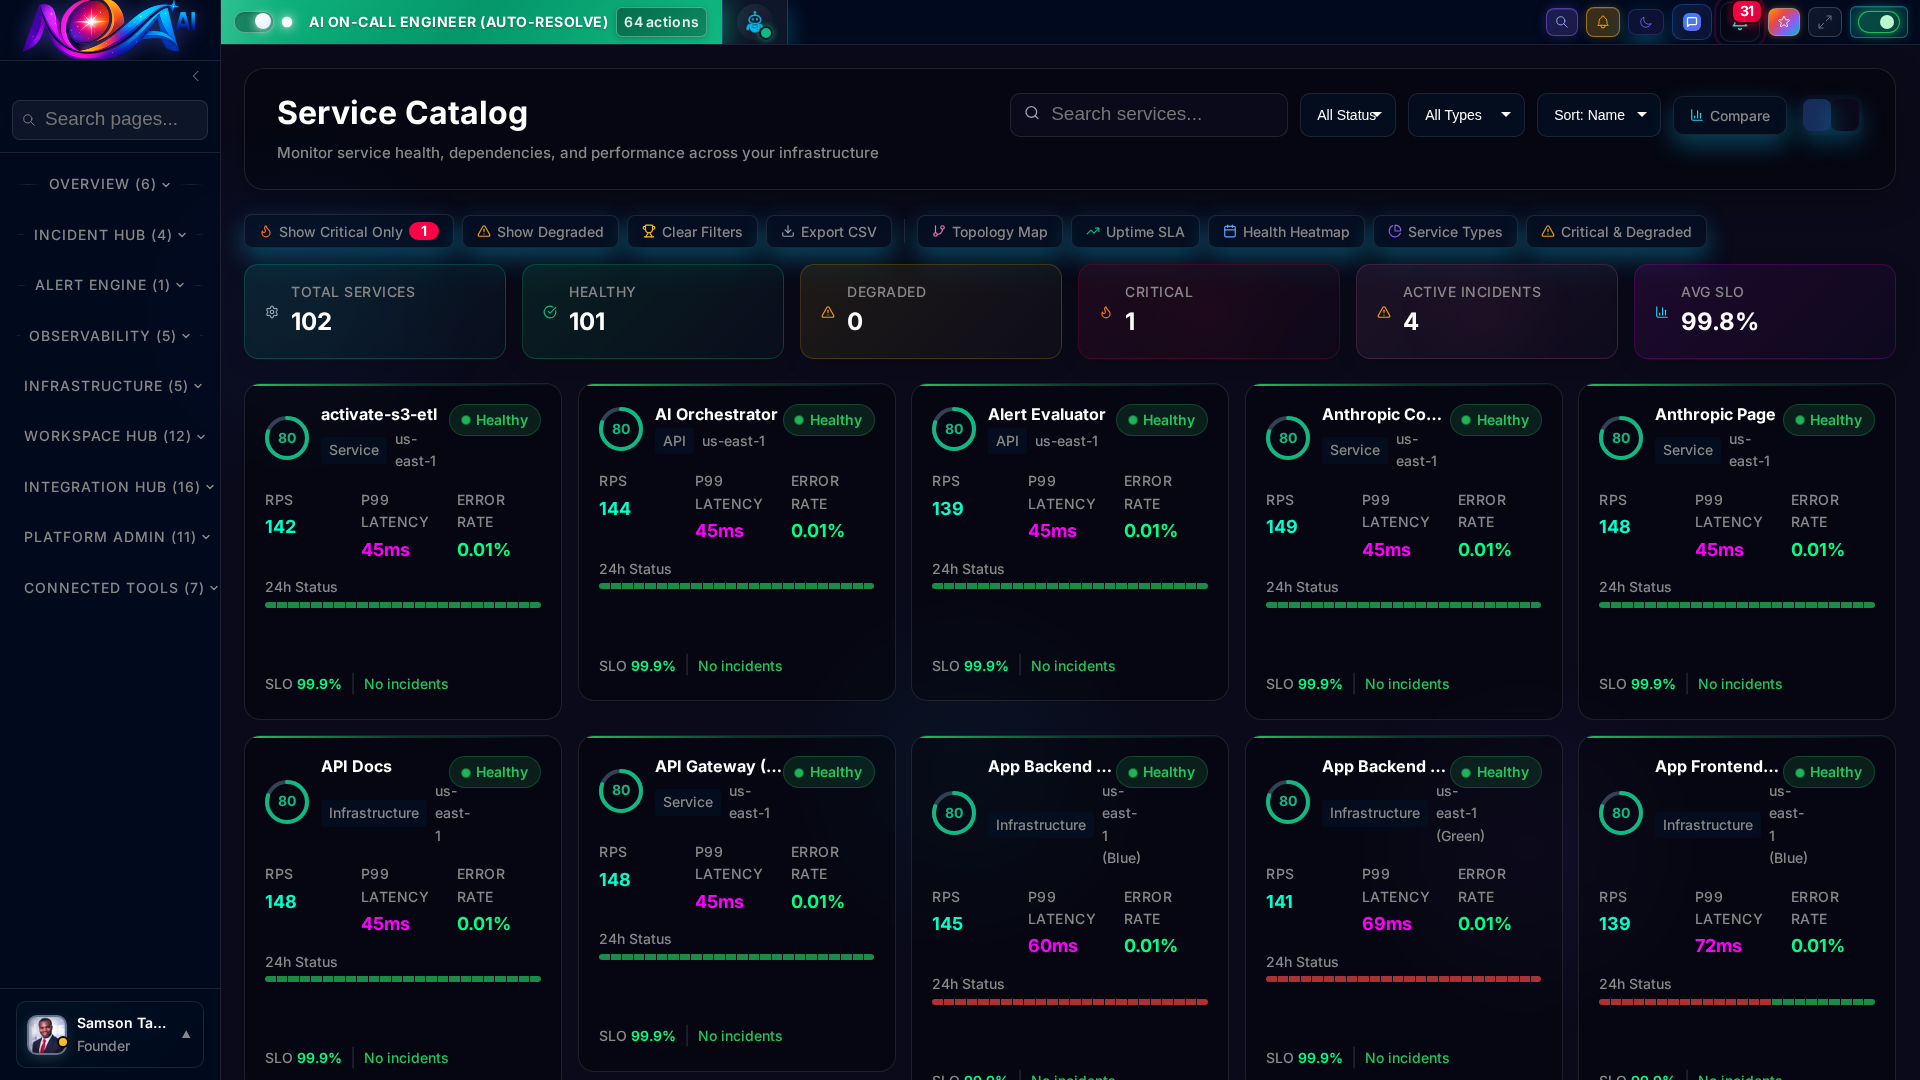
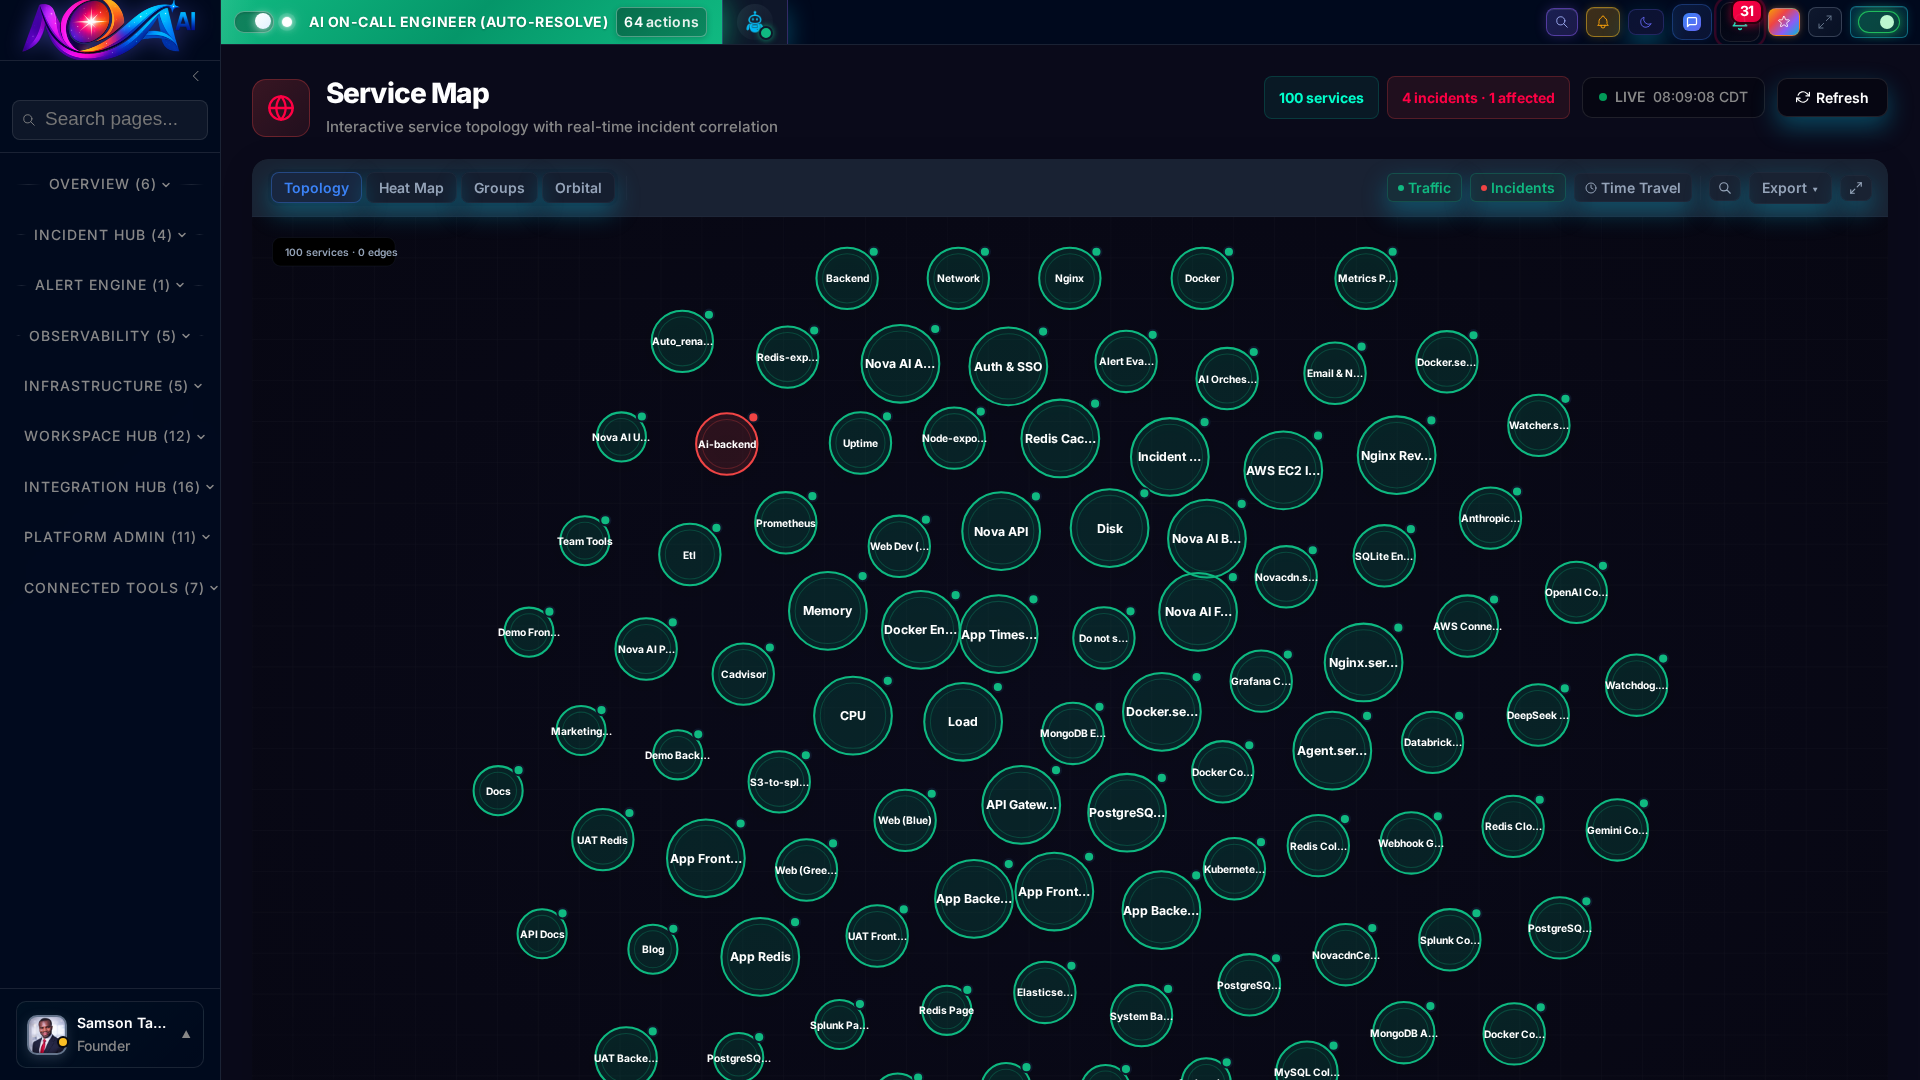
102 services tracked with real-time health, dependency mapping, and SLO compliance. Know the blast radius of every incident before it cascades.
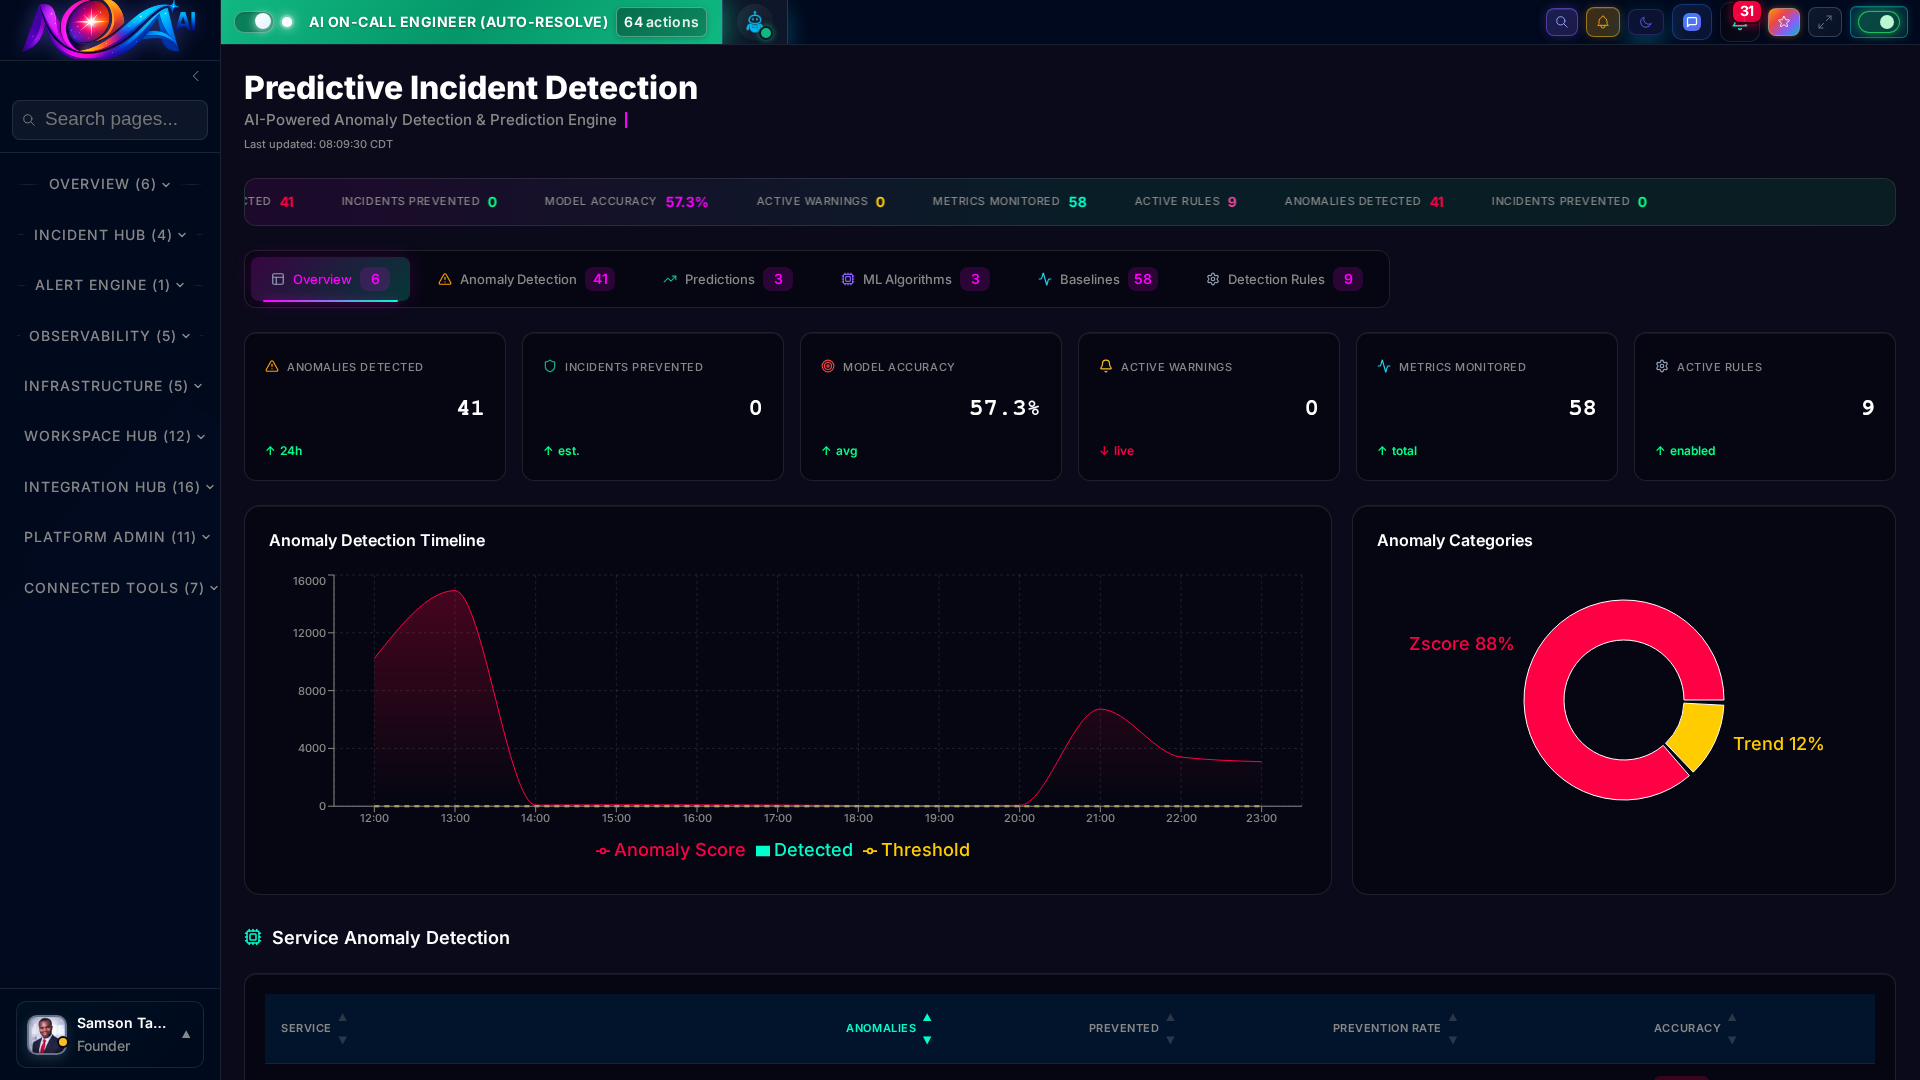
ML models trained on your infrastructure patterns detect anomalies before they become incidents. See the future of your system health.
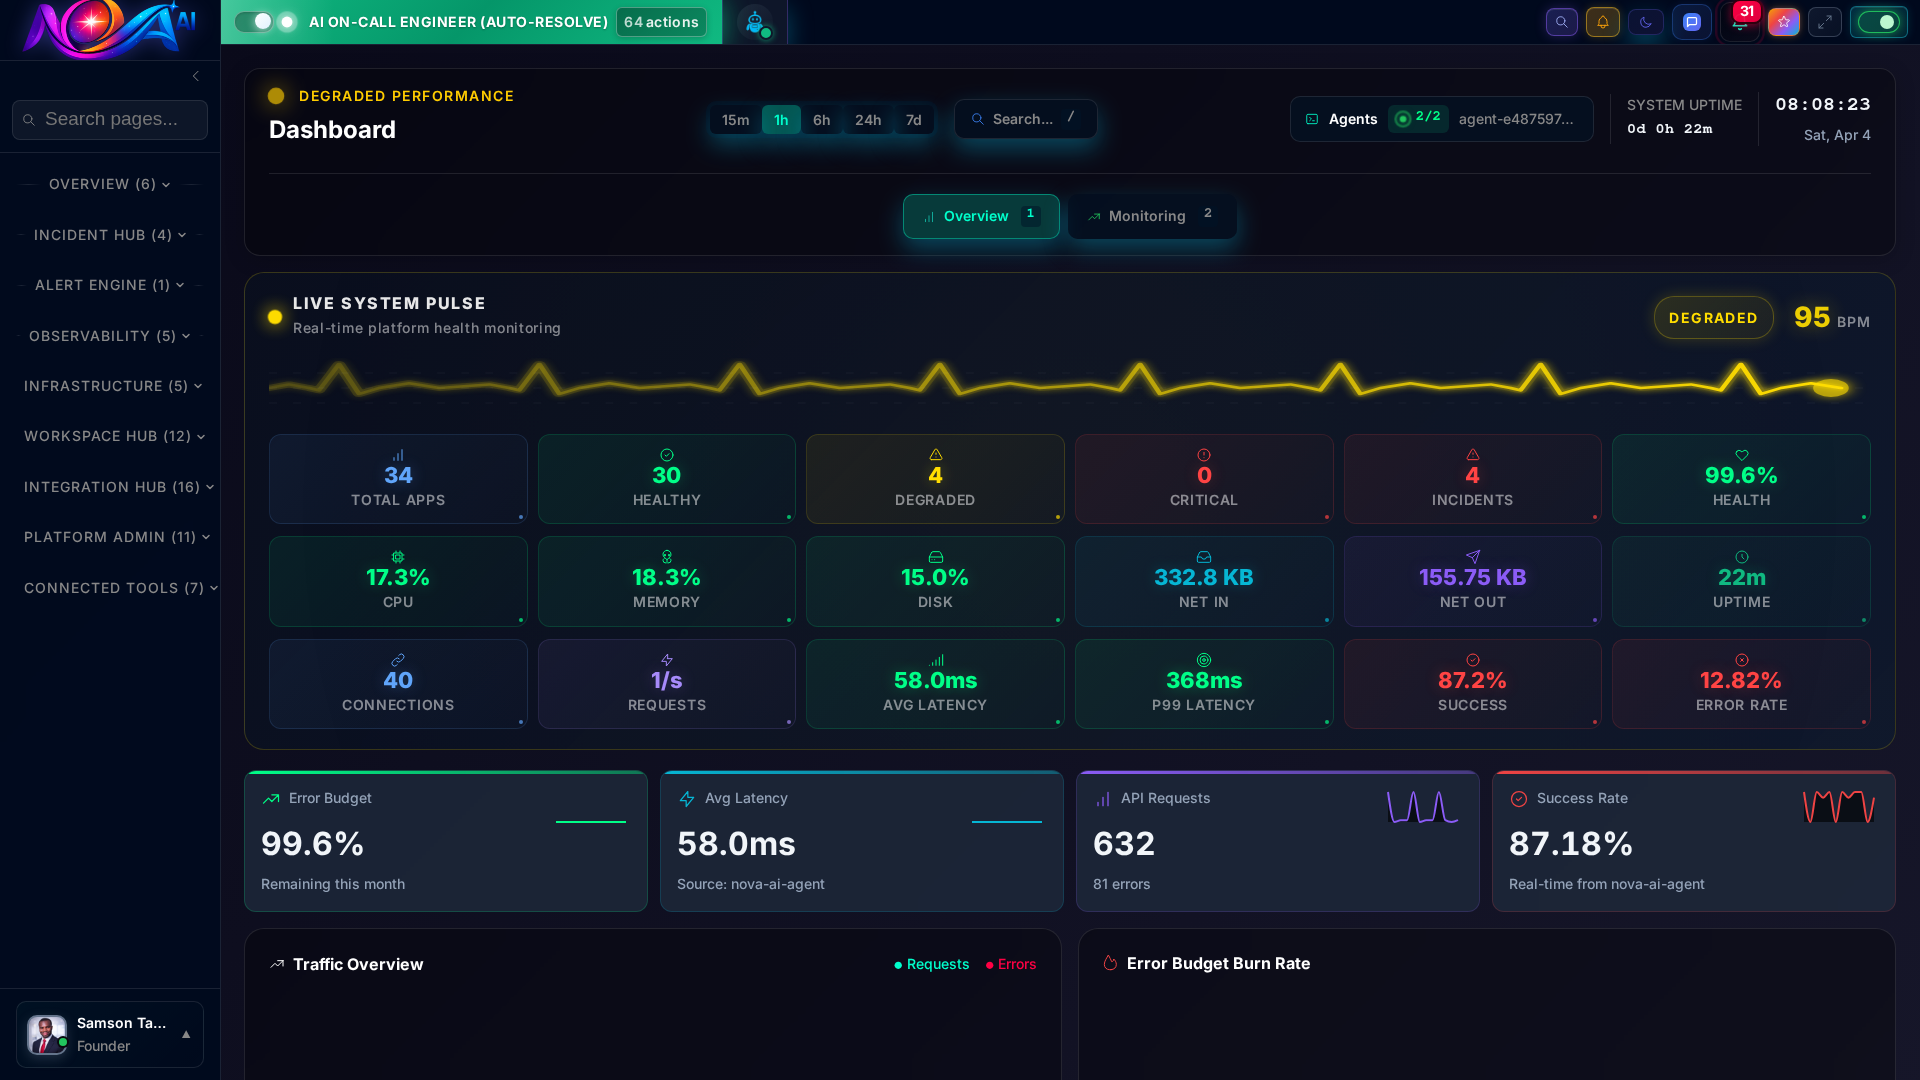
A single pane of glass for your entire infrastructure. Real-time metrics, system health, and operational intelligence — all updating live with zero query lag.
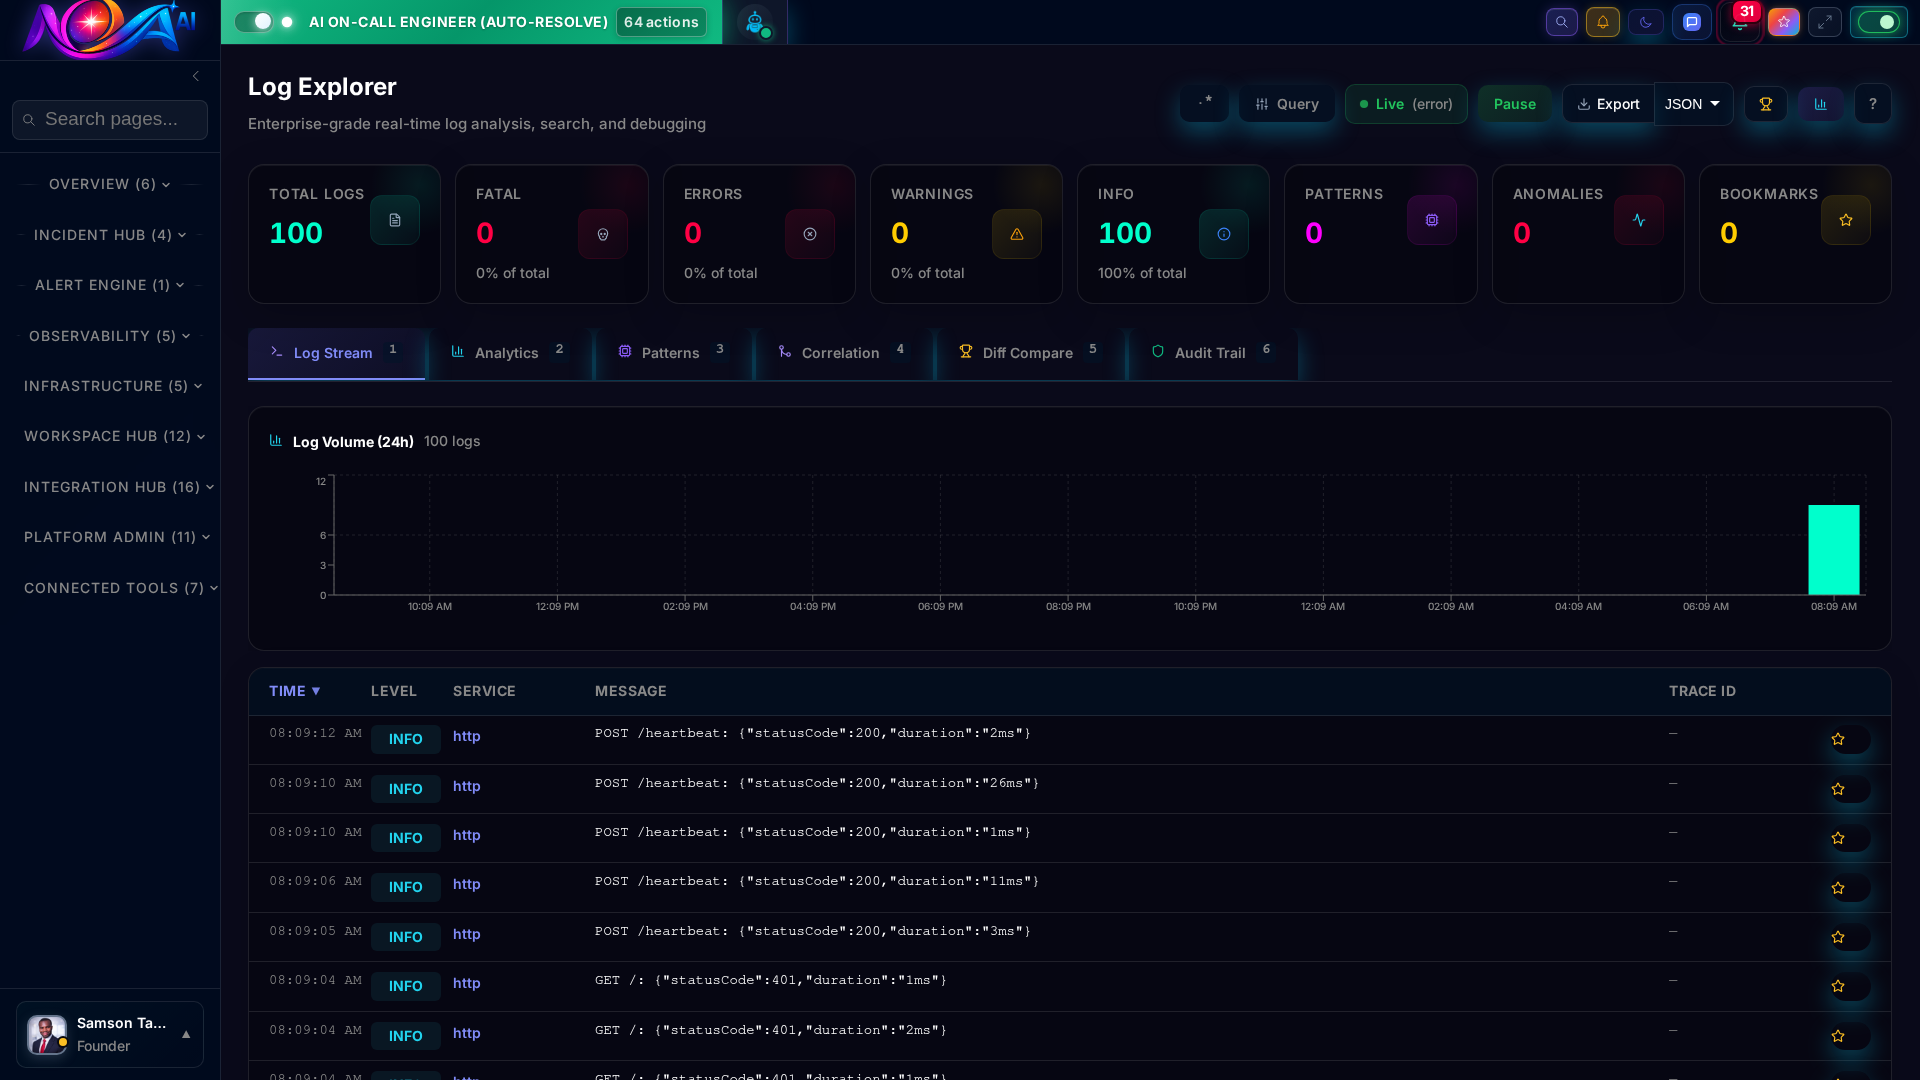
Search billions of log lines in milliseconds. Follow any request across microservices with end-to-end distributed tracing. No more jumping between tools.
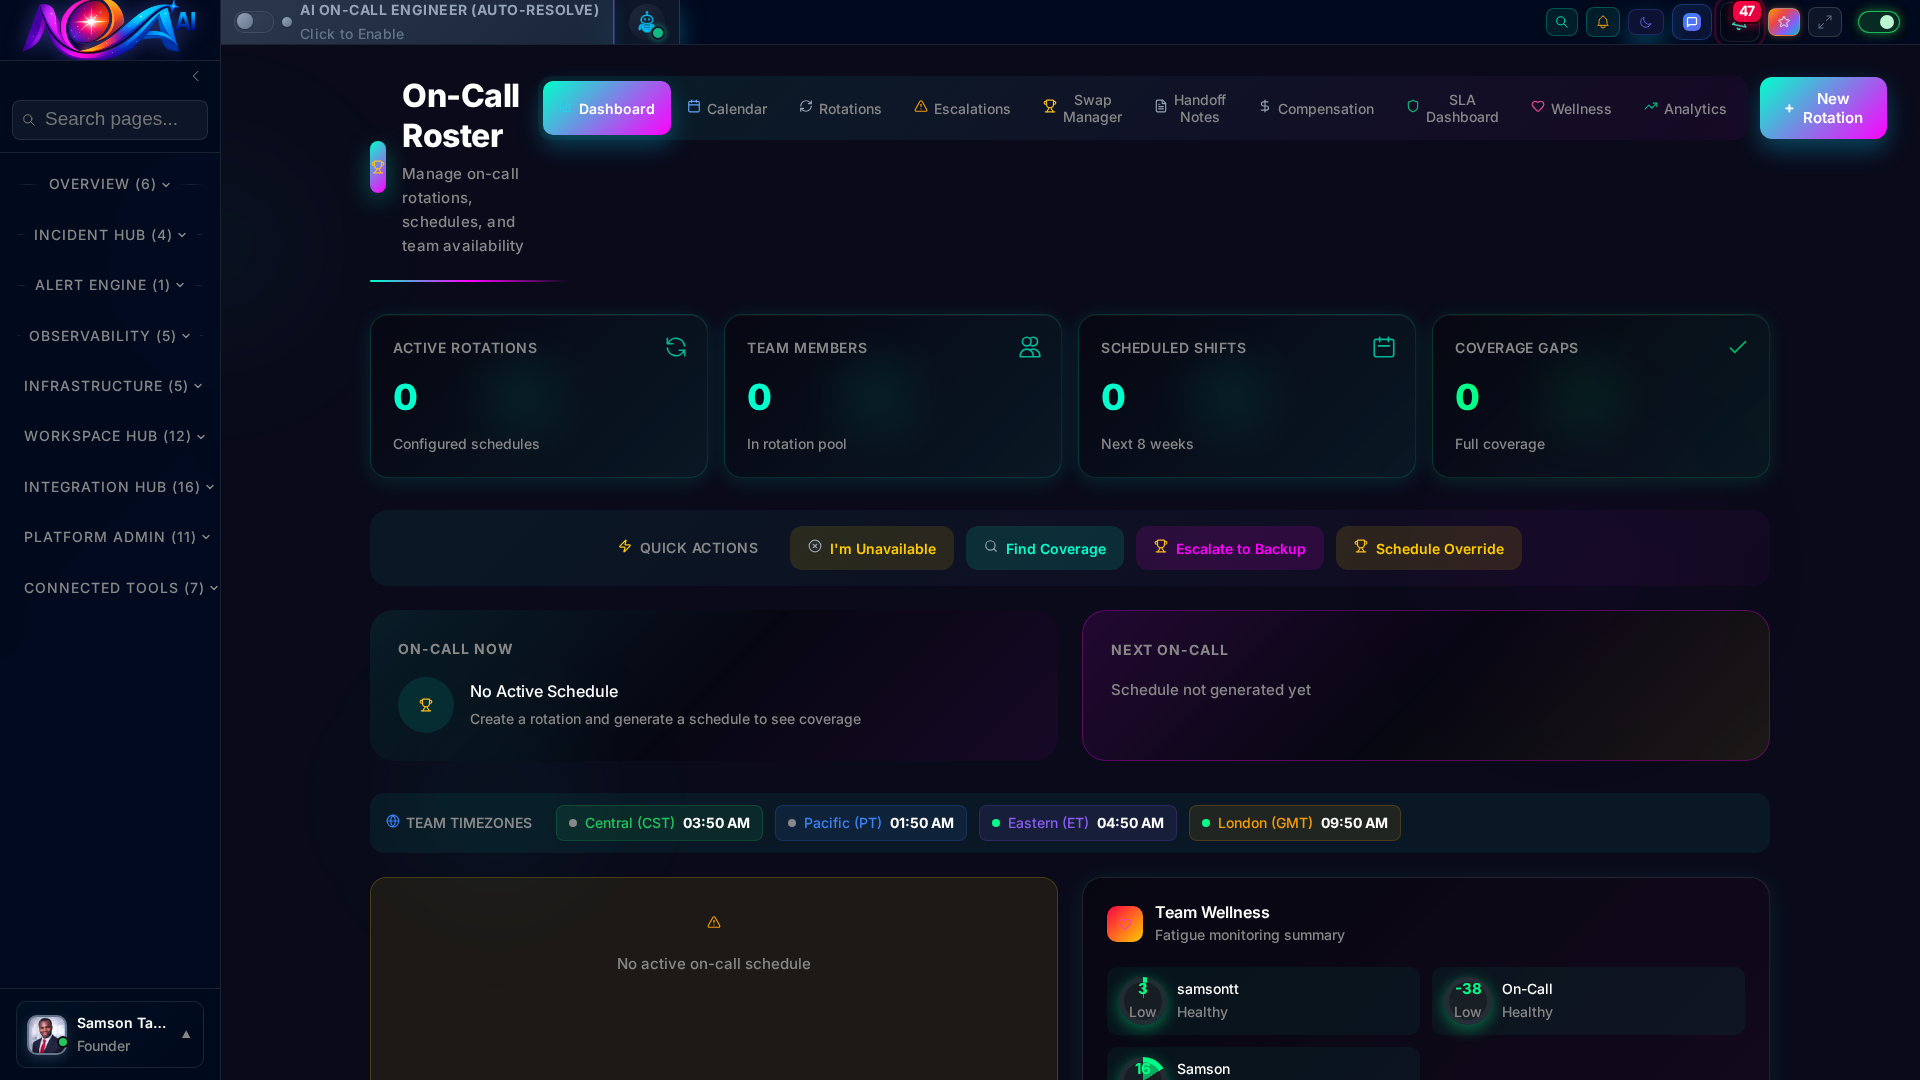
Intelligent on-call scheduling that respects your team's time zones, workload, and fatigue levels. AI routes incidents to the right engineer, every time.
No more spending hours writing incident reports. Nova AI automatically generates comprehensive post-mortems with timeline reconstruction, root cause analysis, and concrete action items.
Visualize your entire microservice architecture as a live dependency graph. See how services connect, where bottlenecks form, and the blast radius of any failure in real time.
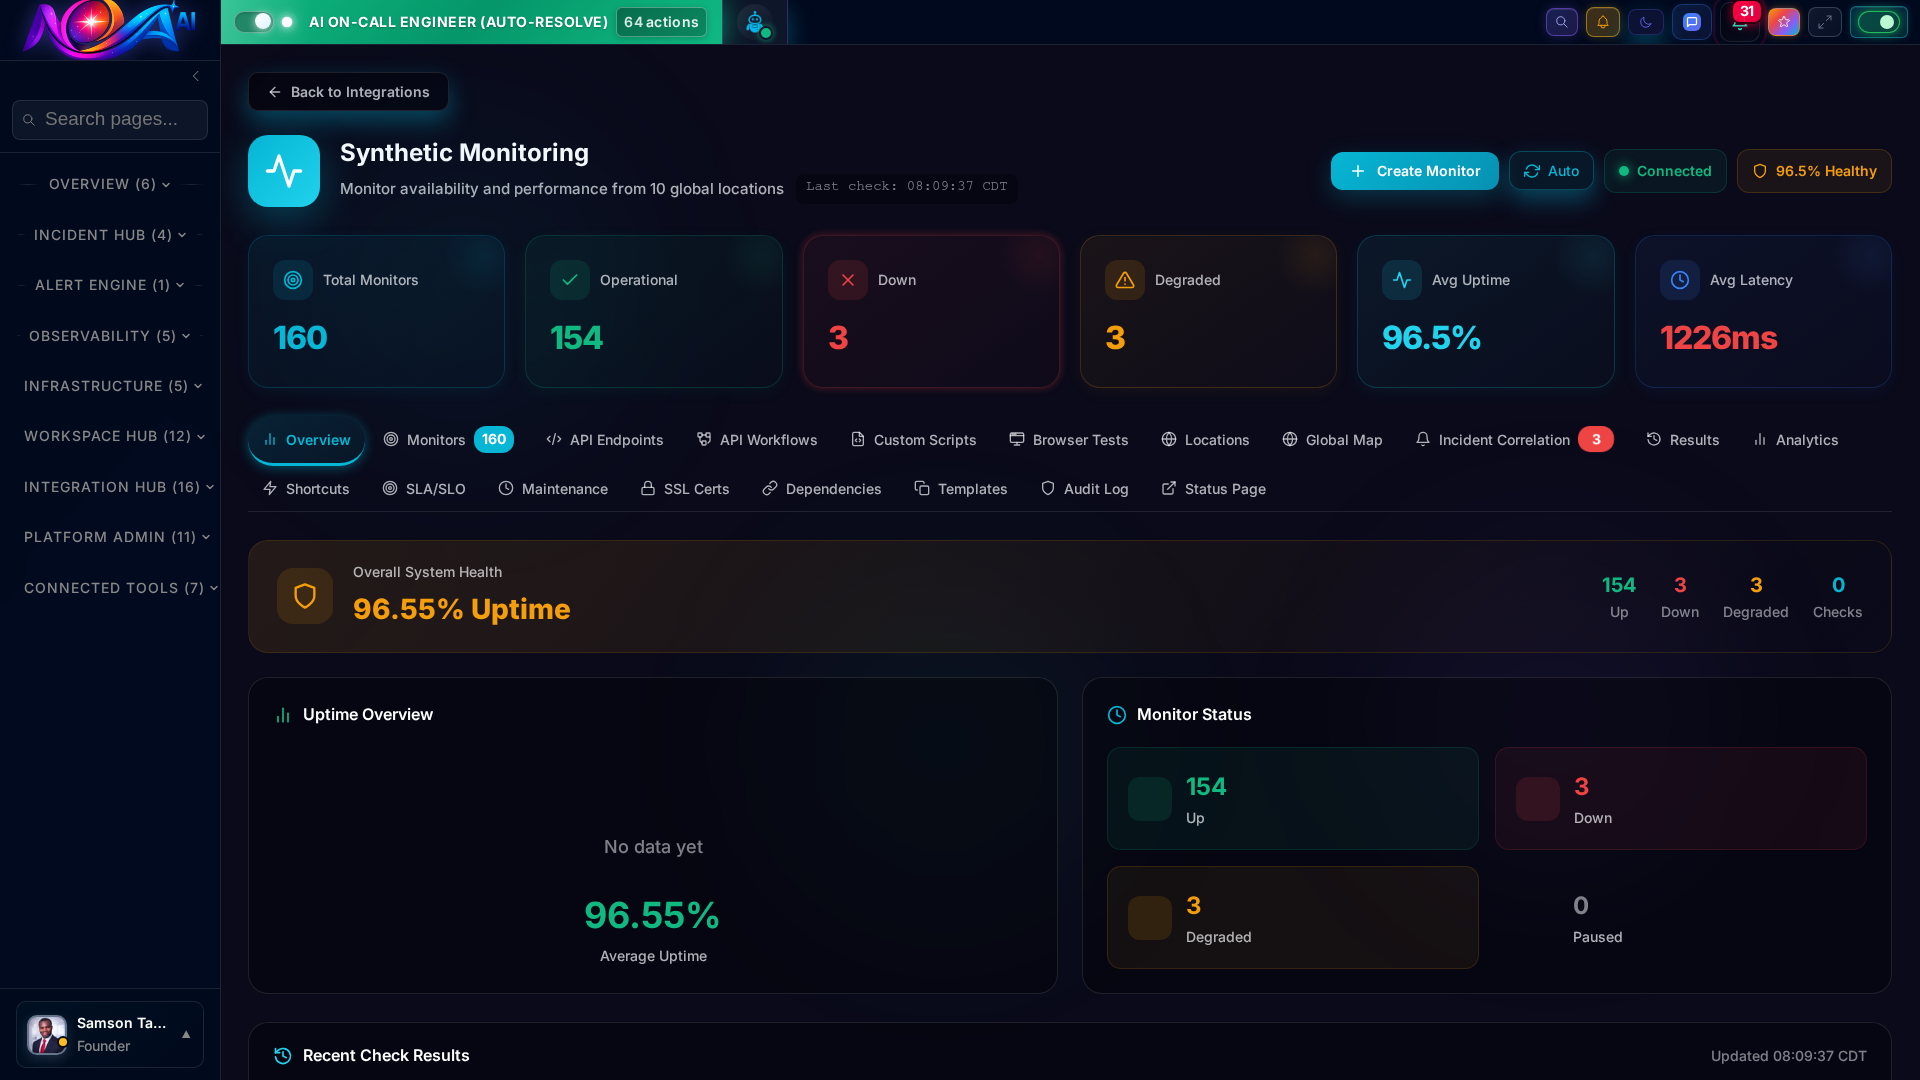
Proactively test your APIs, websites, and critical user flows from locations worldwide. Know about outages before your customers do — every 30 seconds.
Track infrastructure performance over weeks and months. Spot degradation trends, capacity risks, and optimization opportunities before they become incidents.
See exactly what your users experienced during an incident. Pixel-perfect session replays correlated with backend errors give you the full picture — frontend to infrastructure.
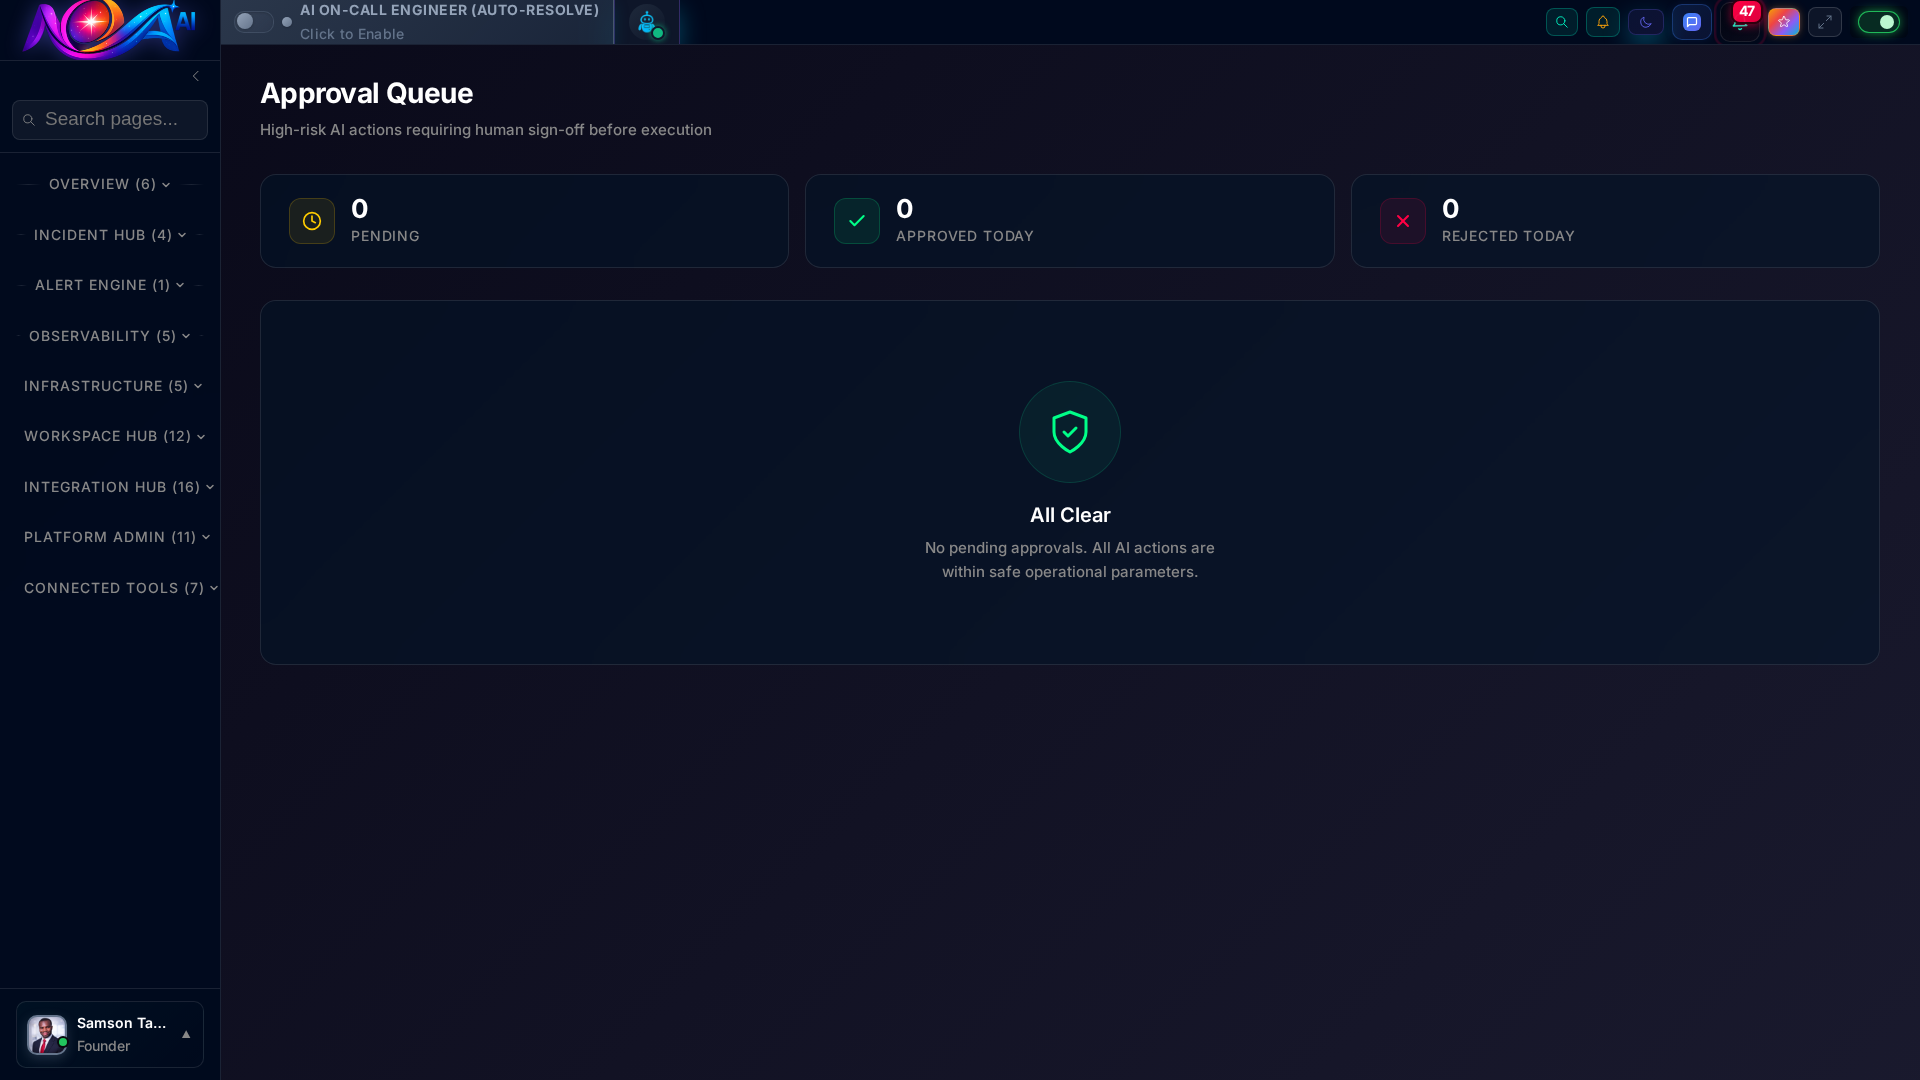
Enterprise-grade change management for AI-driven actions. Every automated remediation flows through configurable approval workflows with full audit trails.
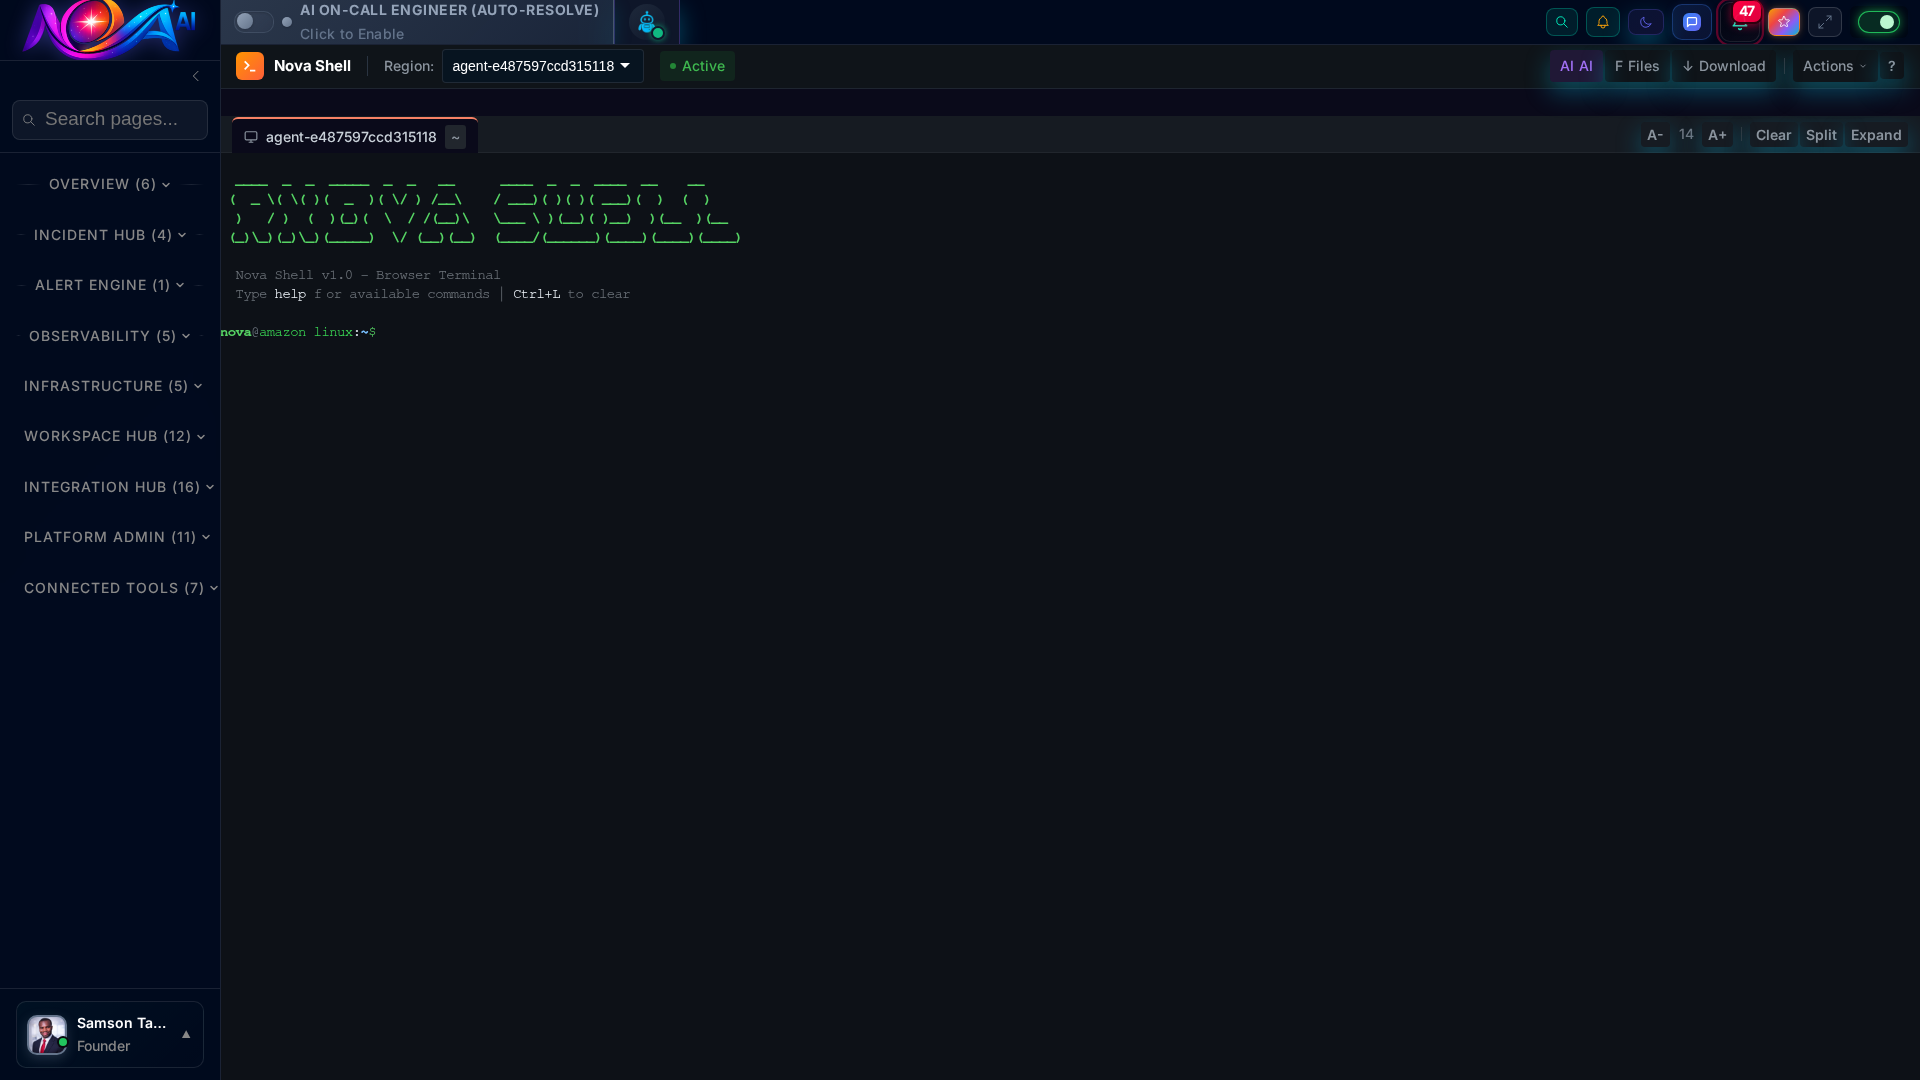
Talk to your infrastructure in plain English. Nova Shell is an AI terminal that translates natural language into kubectl commands, SQL queries, and infrastructure operations.
Nova handles the full incident lifecycle so your team can focus on building.
Nova continuously monitors your infrastructure and surfaces anomalies the moment they appear, not after your customers report them.
Instead of manually jumping between dashboards, Nova's AI agents automatically trace the incident to its root cause.
Nova doesn't just find problems -- it fixes them. AI-driven runbooks execute proven remediation steps automatically.
Everything your reliability team needs, built in, not bolted on.
Unified metrics, logs, and traces across your entire stack with AI-powered anomaly detection.
End-to-end incident lifecycle from detection to resolution with automatic escalation.
Intelligent runbooks that learn from past incidents and automate proven remediation steps.
Smart scheduling with automatic rotation, override management, and fatigue prevention.
Centralized incident communication across Slack, Teams, email, and status pages.
Workflow automation that connects your tools and executes complex remediation sequences.
Secure storage and rotation of credentials, API keys, and certificates across environments.
Seamless file transfer across AWS, GCP, and Azure with built-in encryption and audit logging.
Nova is built for the teams responsible for keeping production systems running.
Stop context-switching between monitoring tools during incidents. Nova gives you a single command center with AI that surfaces what matters and automates what doesn't.
Automate your runbooks, consolidate your toolchain, and get back to building infrastructure instead of fighting fires at 3am.
Give your engineering org a single pane of glass for reliability. Standardize incident response and ensure nothing falls through the cracks.
Watch a real Nova agent deploy in under 40 seconds
Teams using Nova AI resolve incidents 8x faster and eliminate 80% of alert noise overnight.
From anomaly detection to self-healing resolution, Nova AI handles the entire incident lifecycle.
ML models continuously analyze metrics, logs, and traces. Anomalies are caught before they escalate into customer-facing incidents.
AI cross-references signals across your entire stack. Related alerts are deduplicated and grouped into a single actionable incident.
AI agents execute proven runbooks automatically. High-risk actions go through approval queues. Known issues resolve in seconds, not hours.
Every incident improves the system. AI generates post-mortems, updates runbooks, and tunes detection thresholds for next time.
One platform. Every signal. Complete control over your infrastructure.
 System OverviewReal-time DashboardAI Agent FleetGolden SignalsIncident Timeline
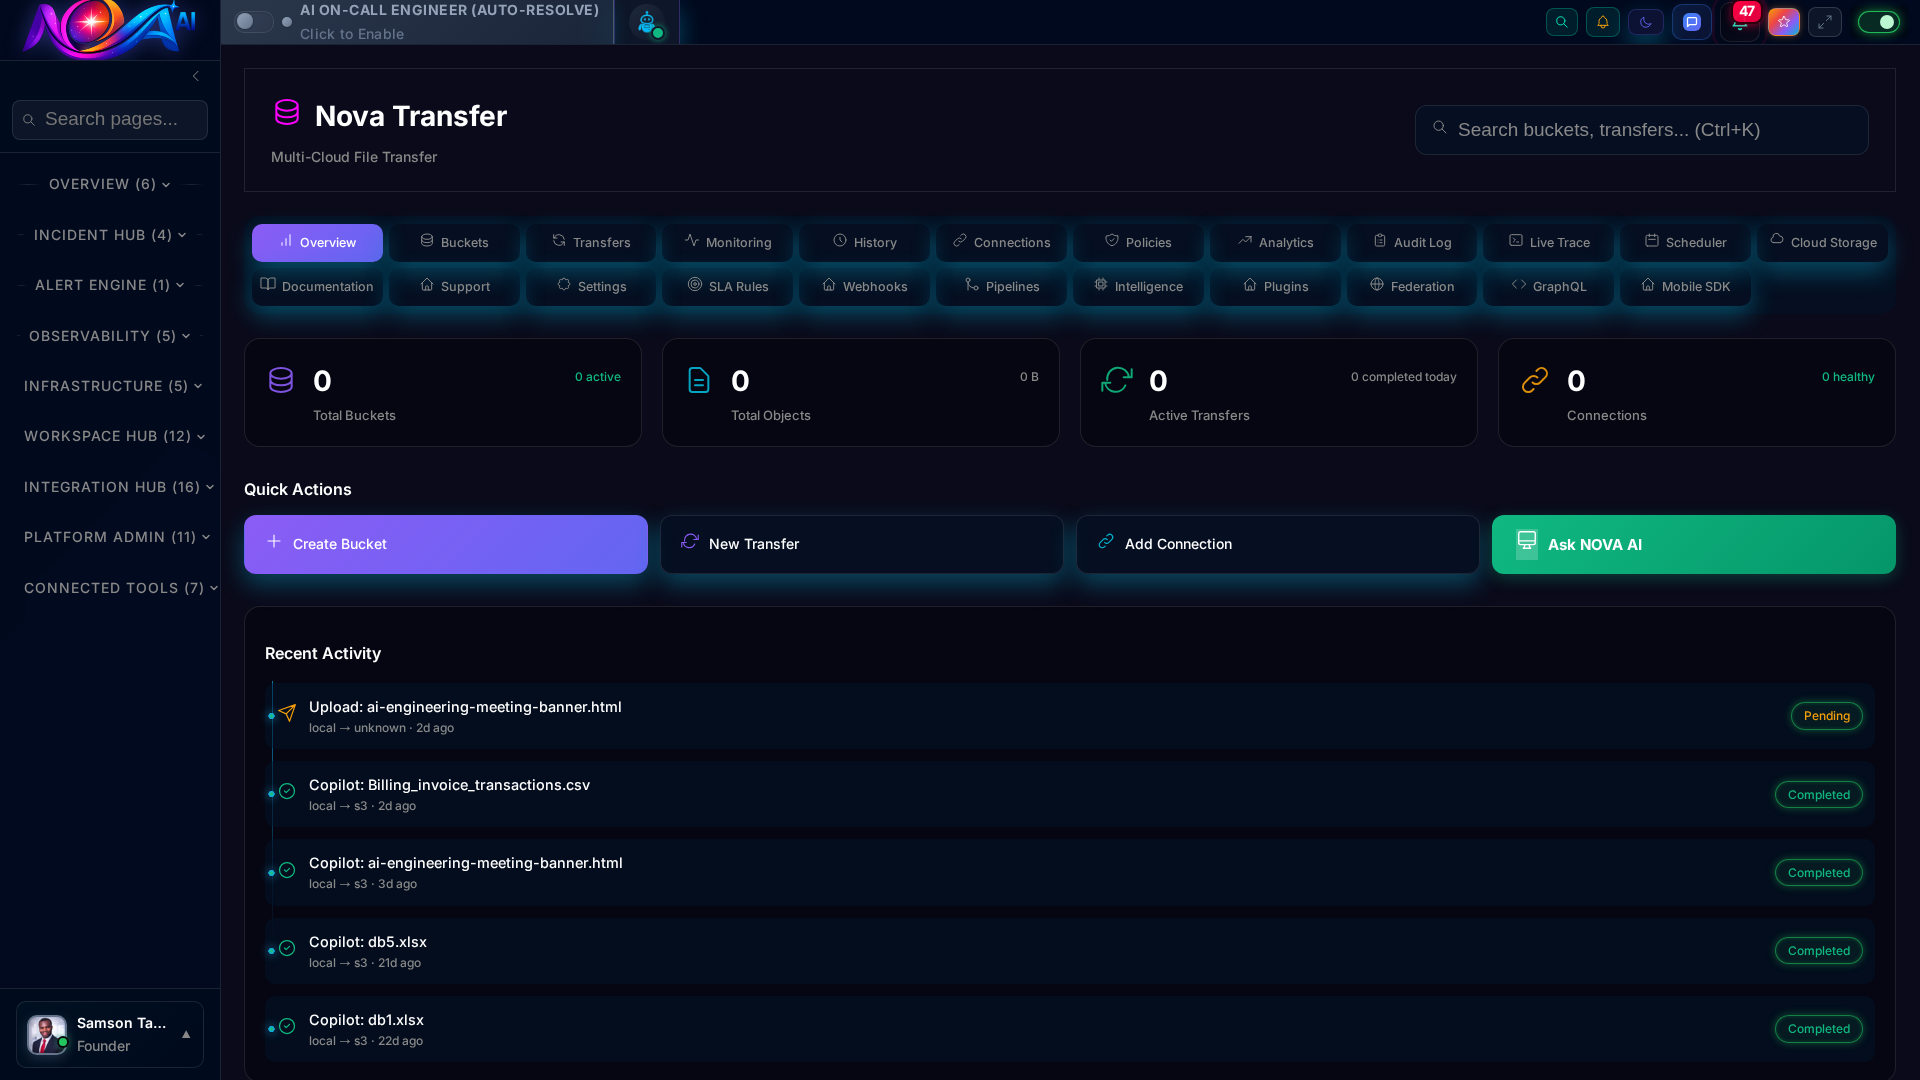 Nova TransferService CatalogOn-Call RosterAI Runbooks
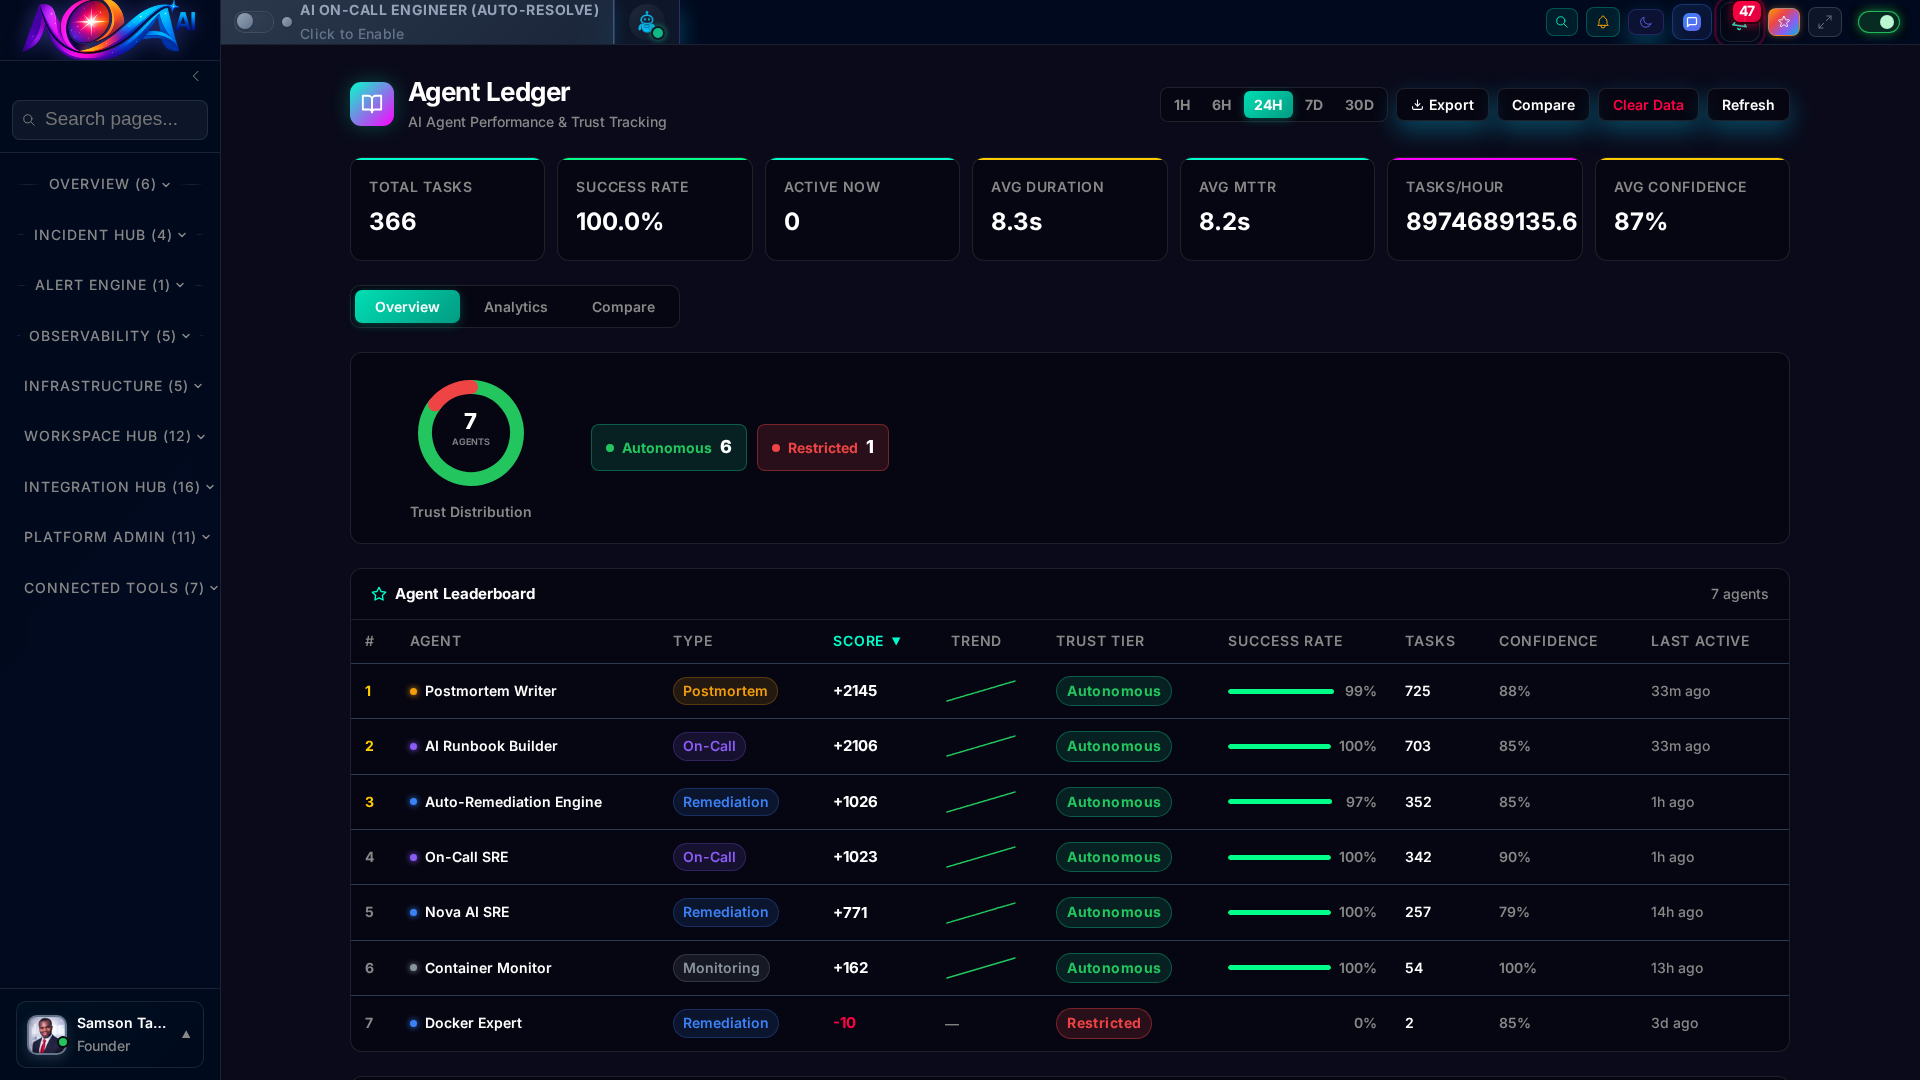 Agent Ledger
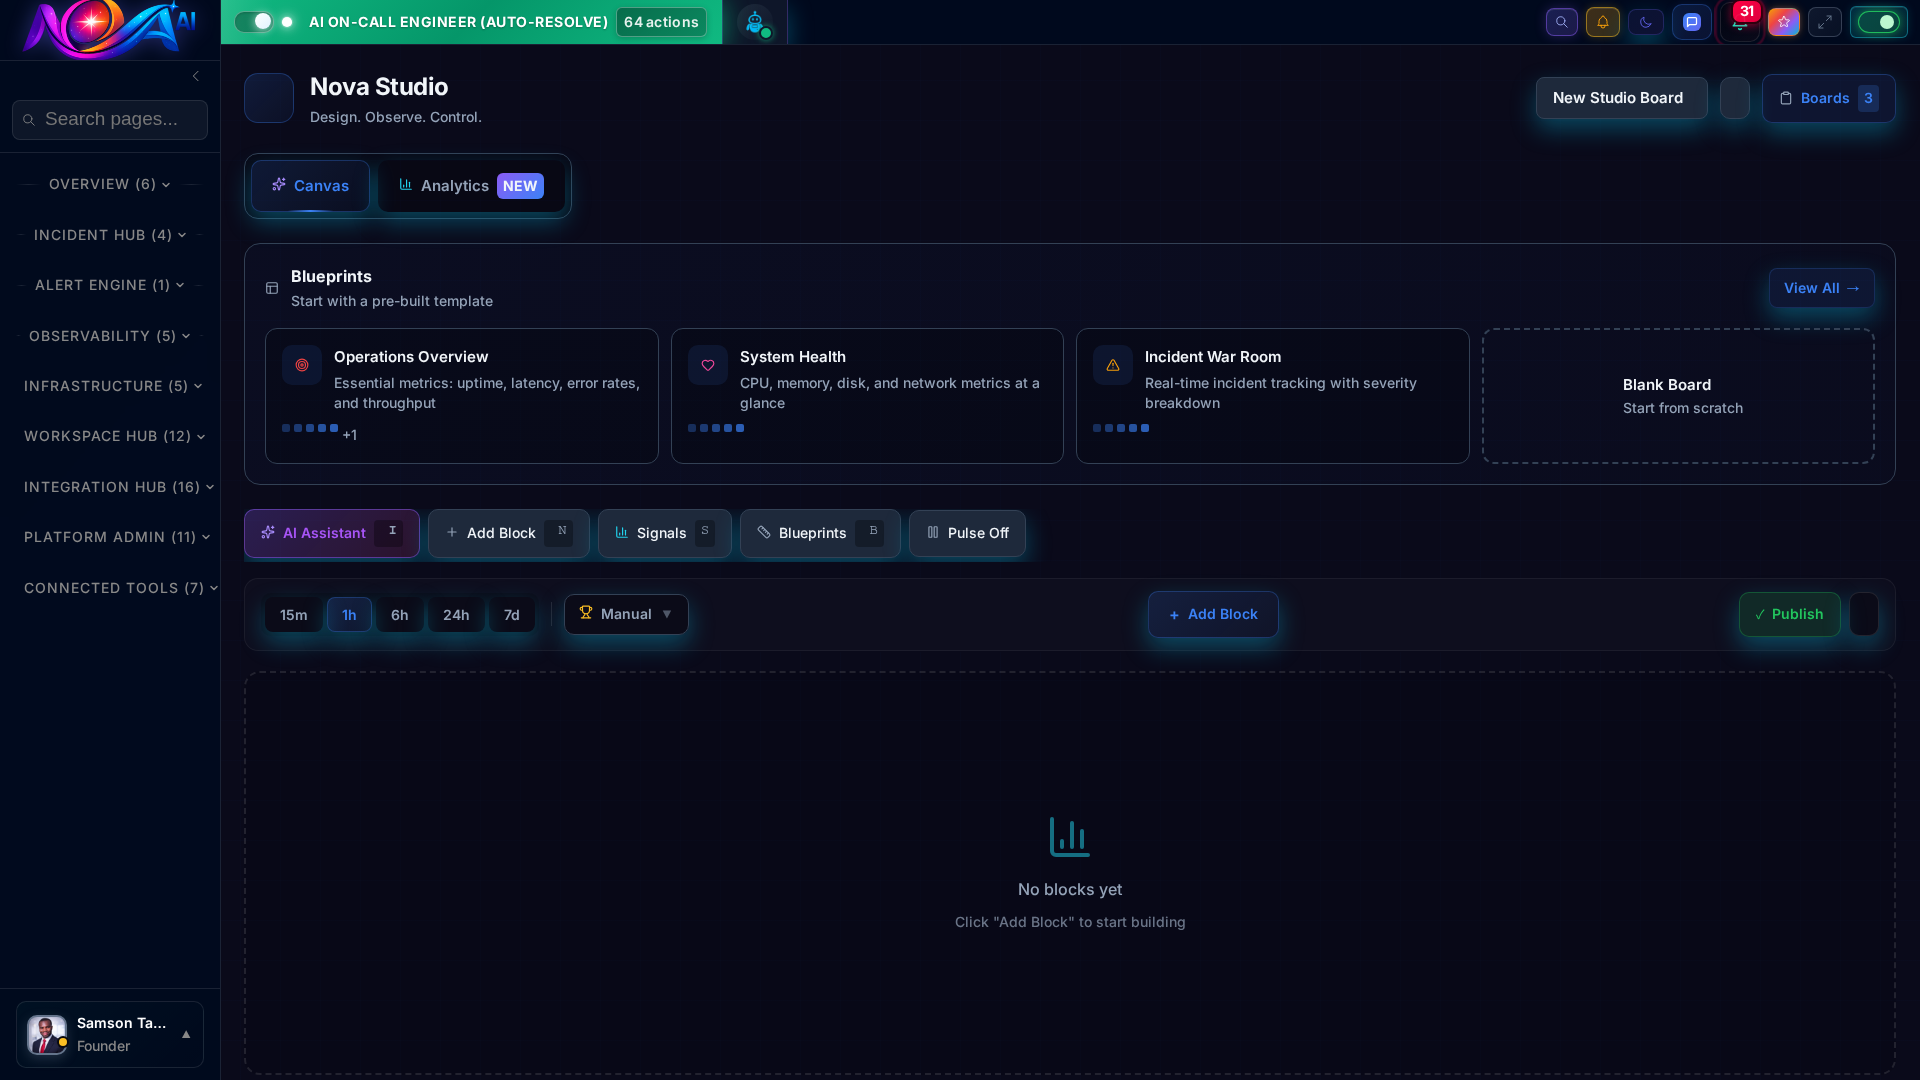 Dashboard Studio
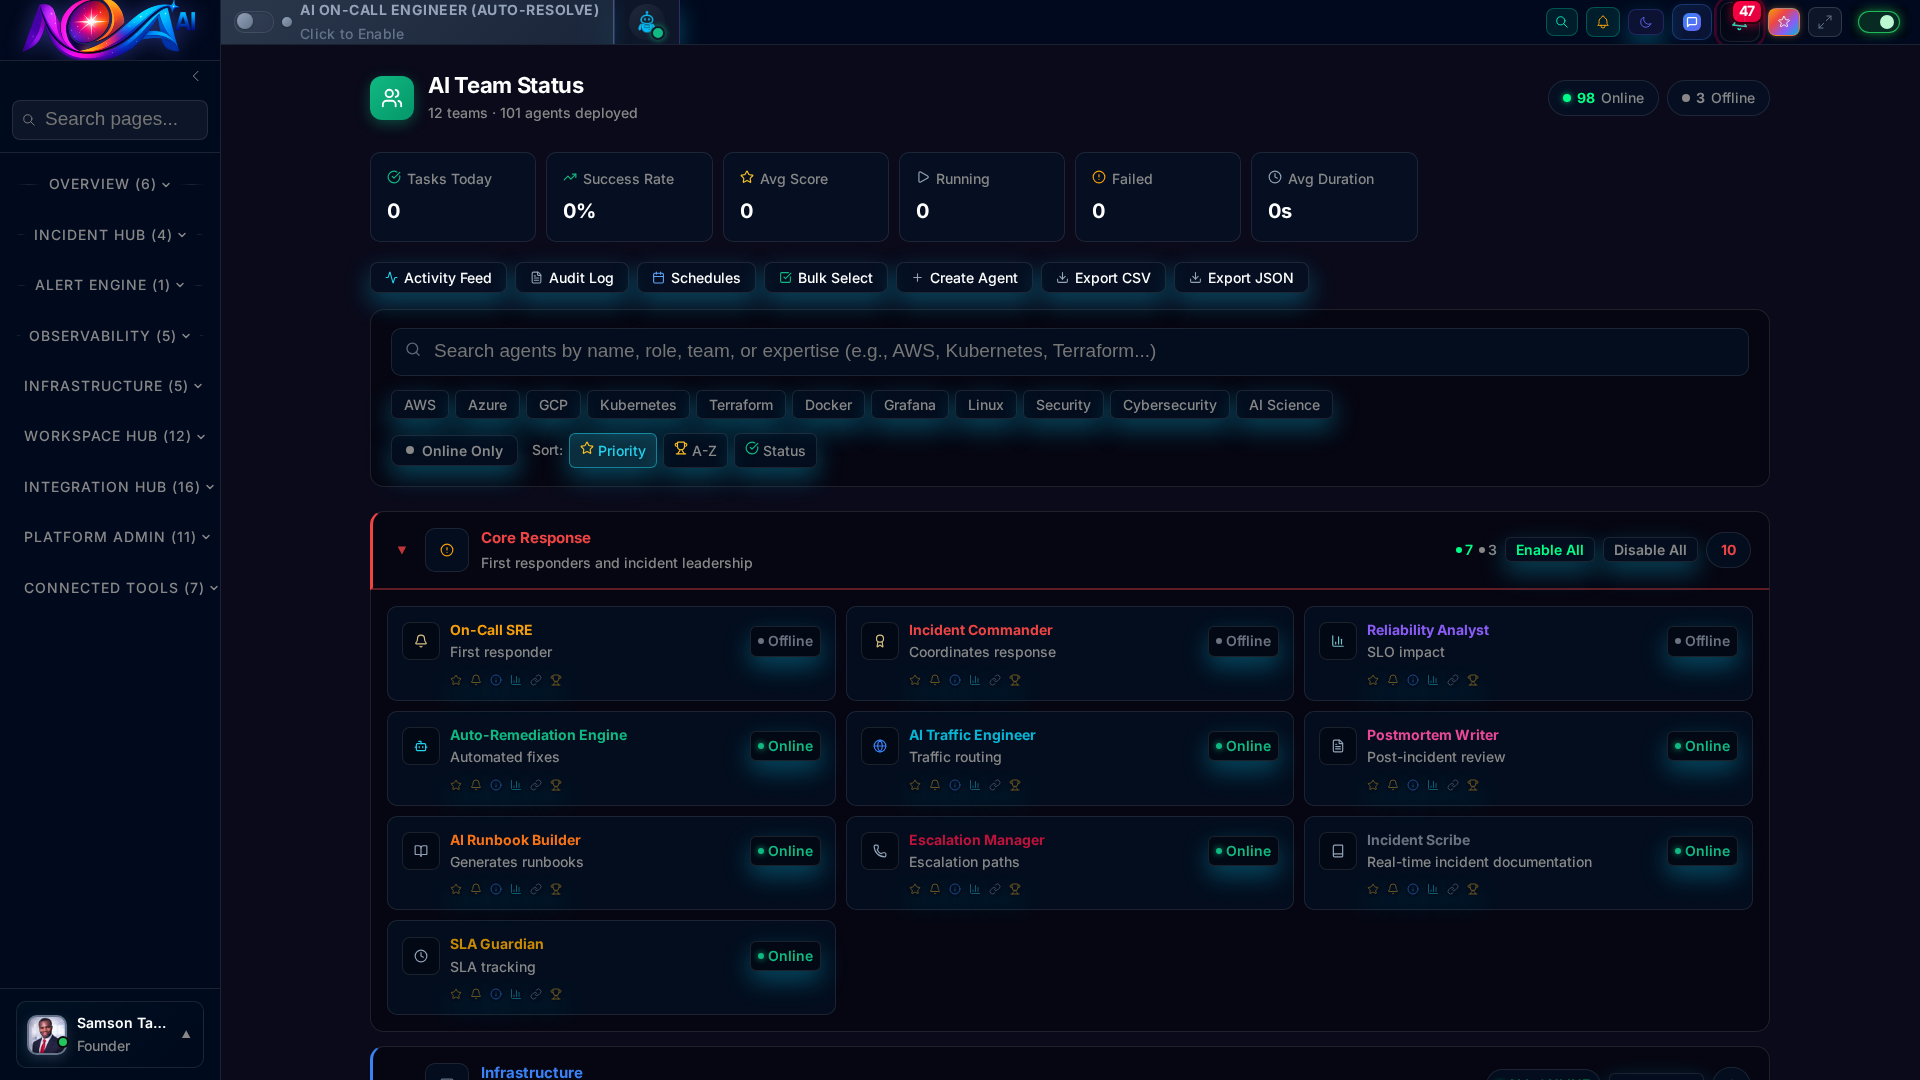 AI Team StatusLog Explorer
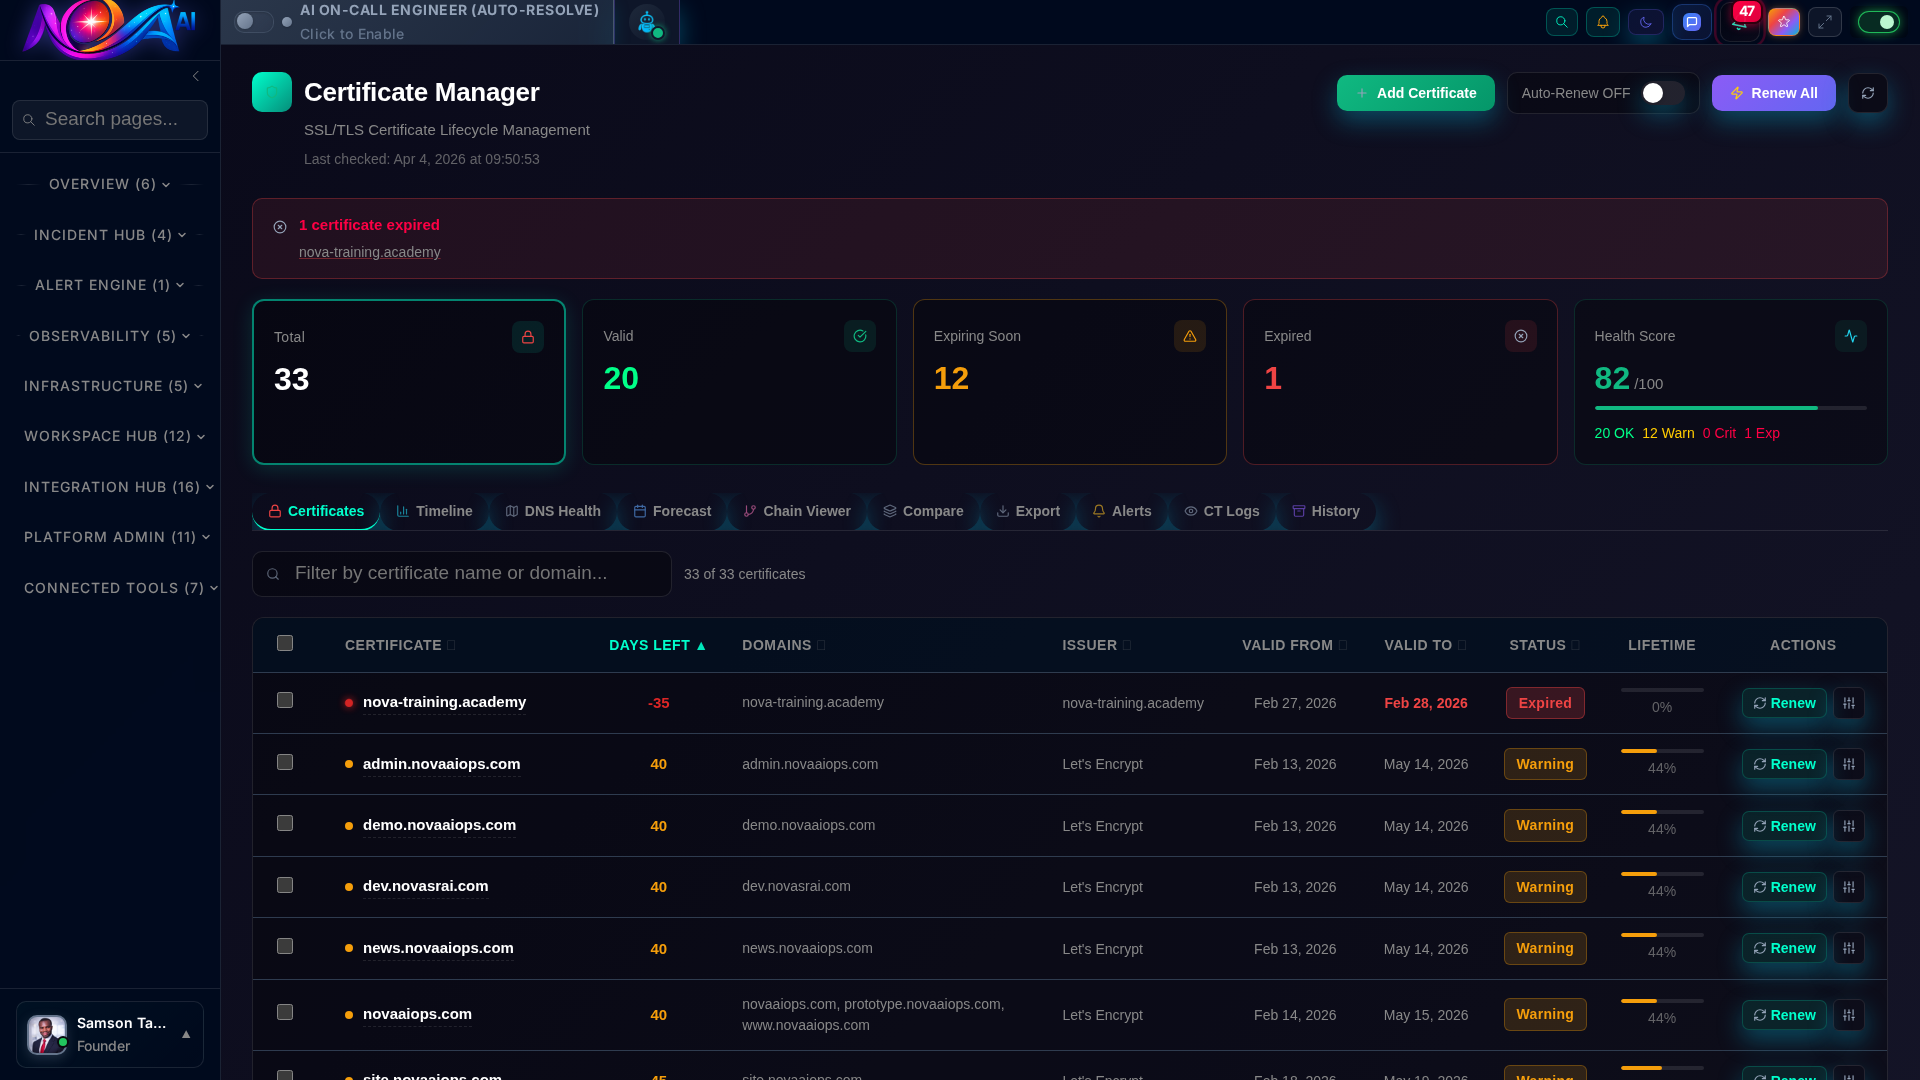 Certificate Manager
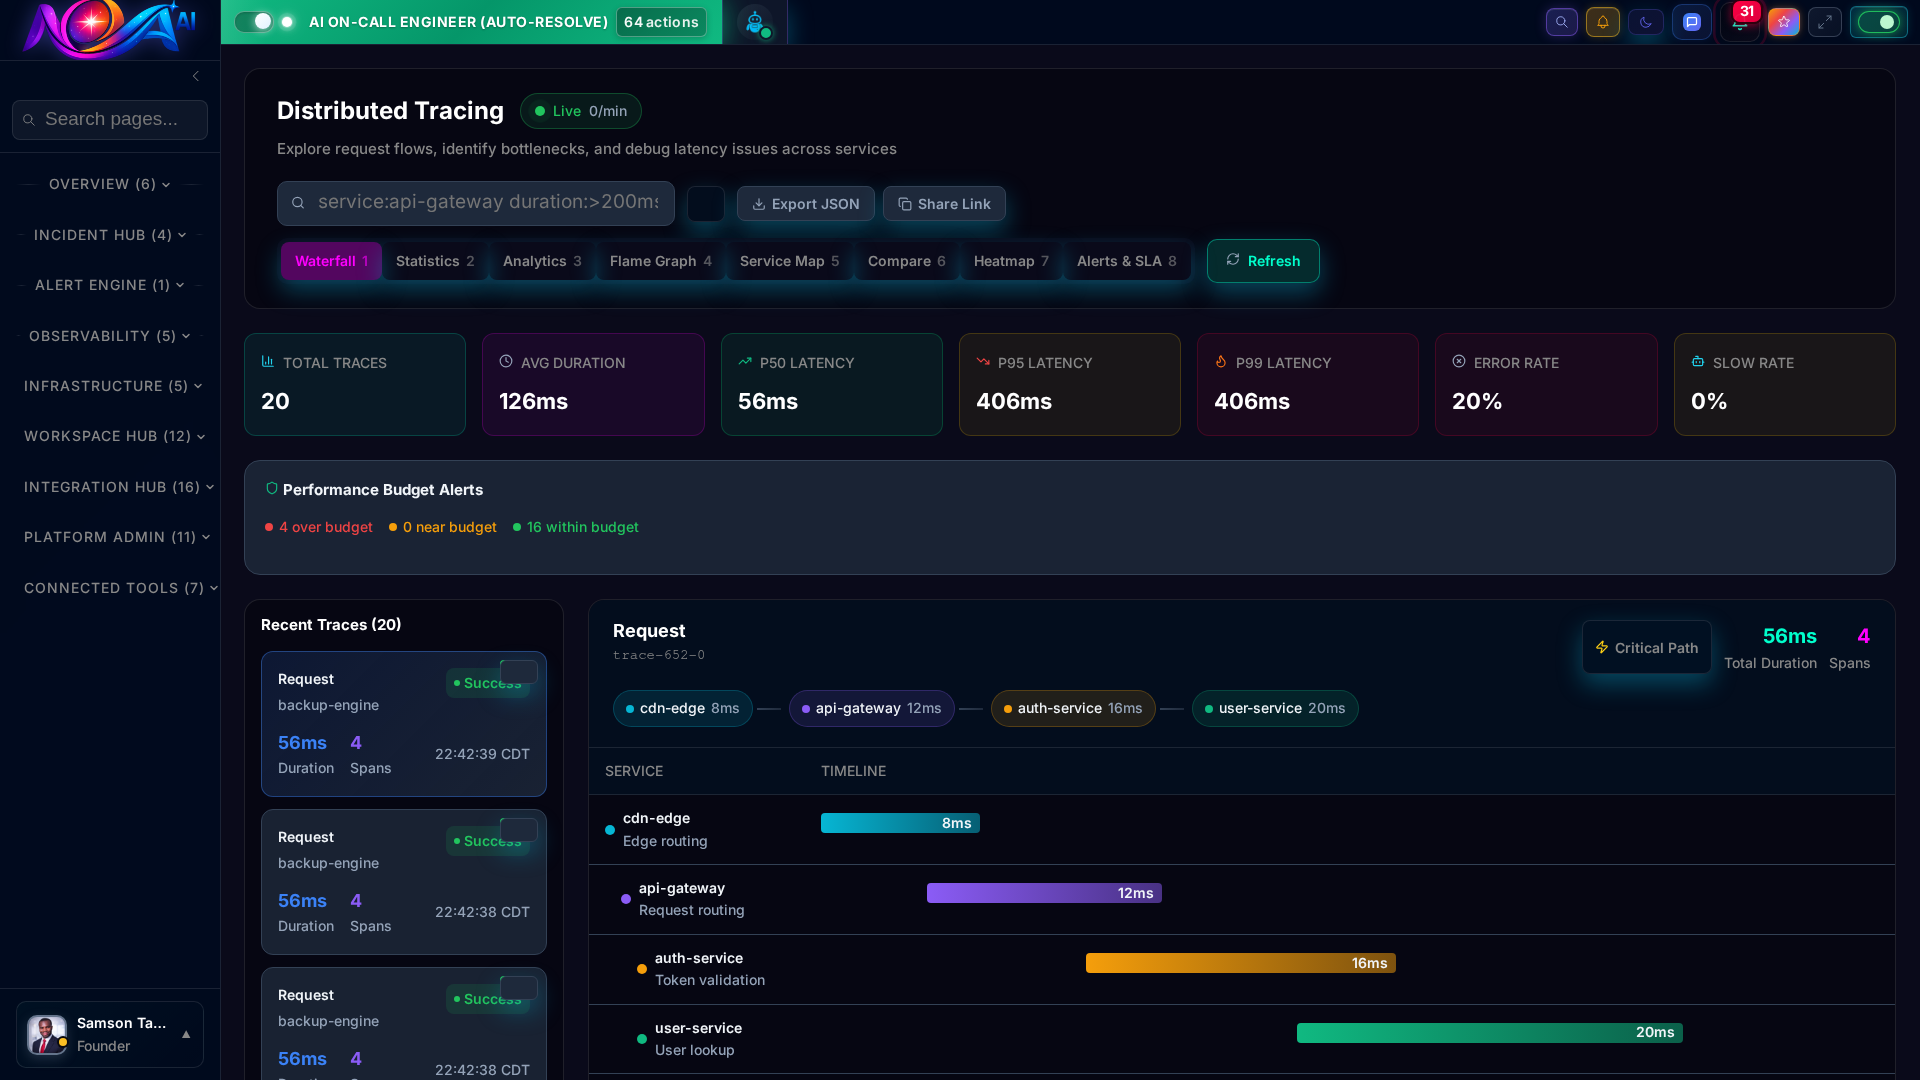 Request Tracing
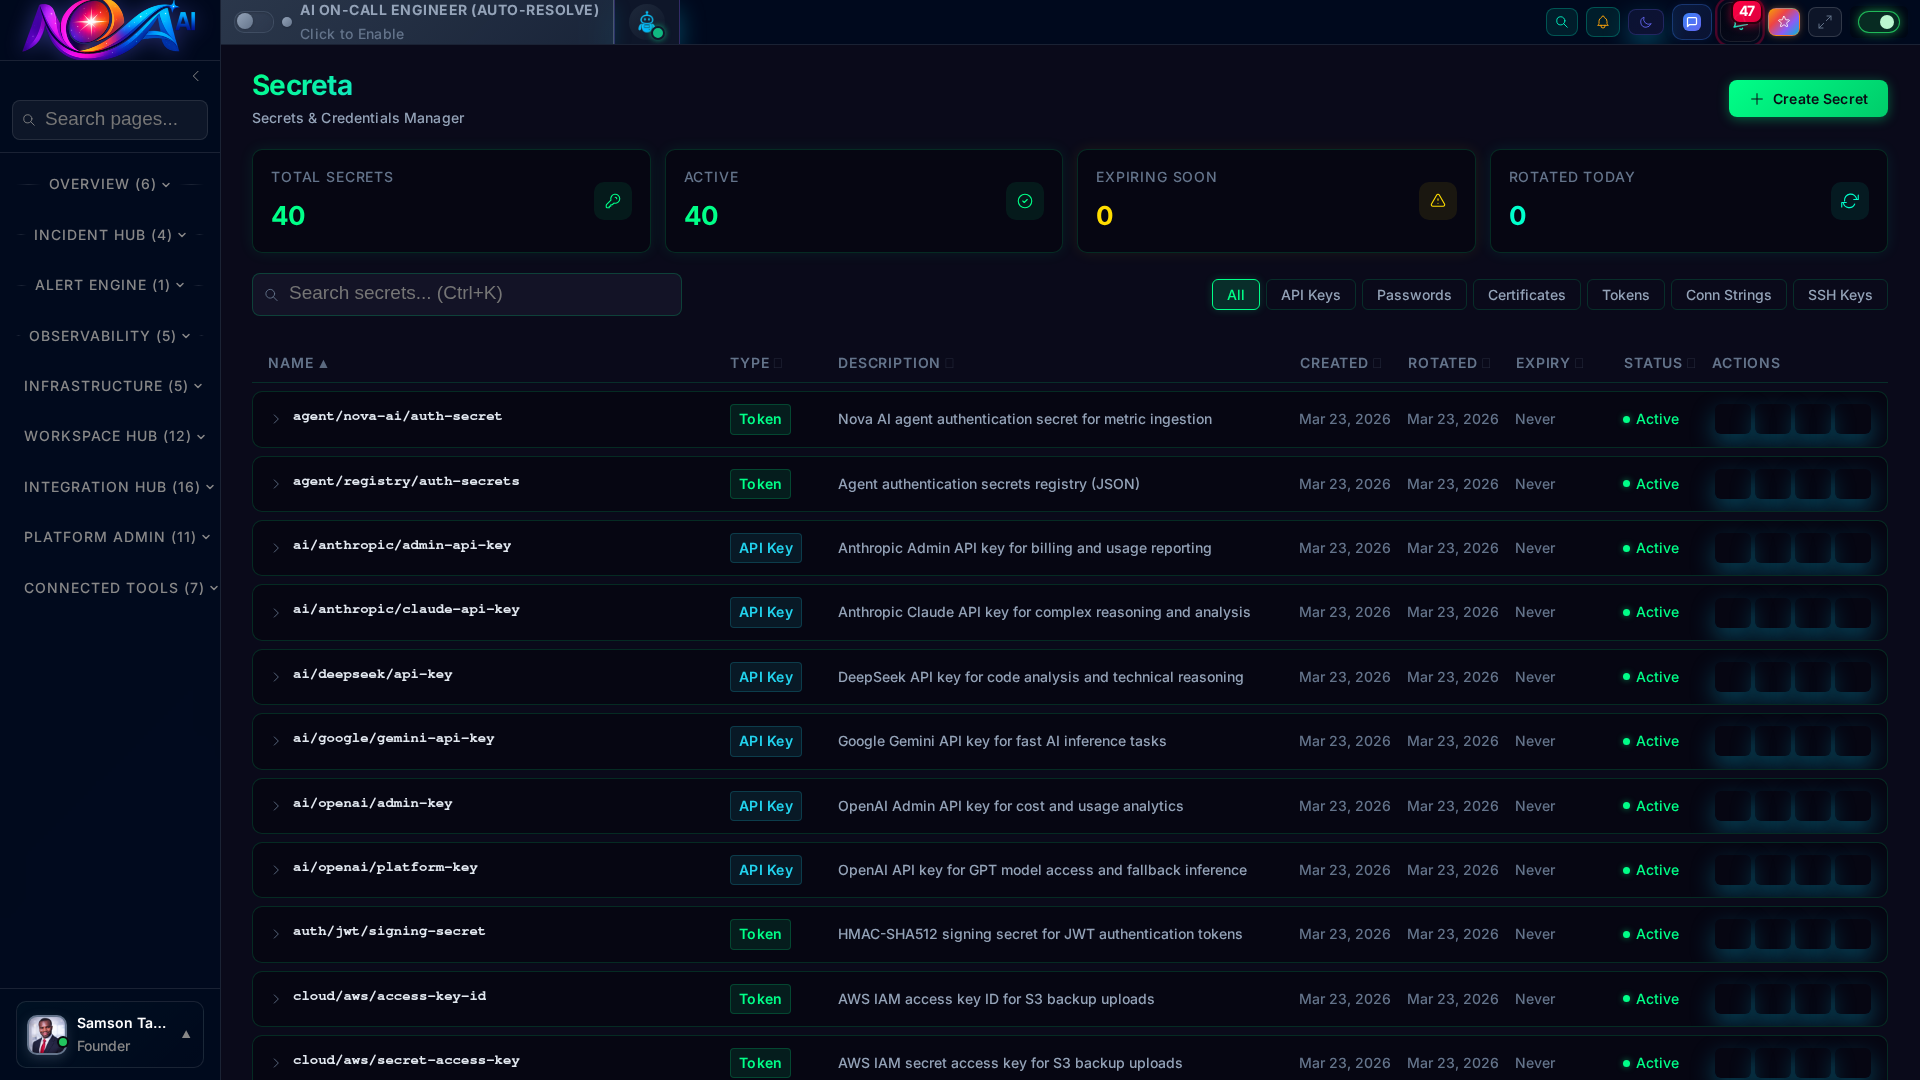 Secrets ManagerService Map
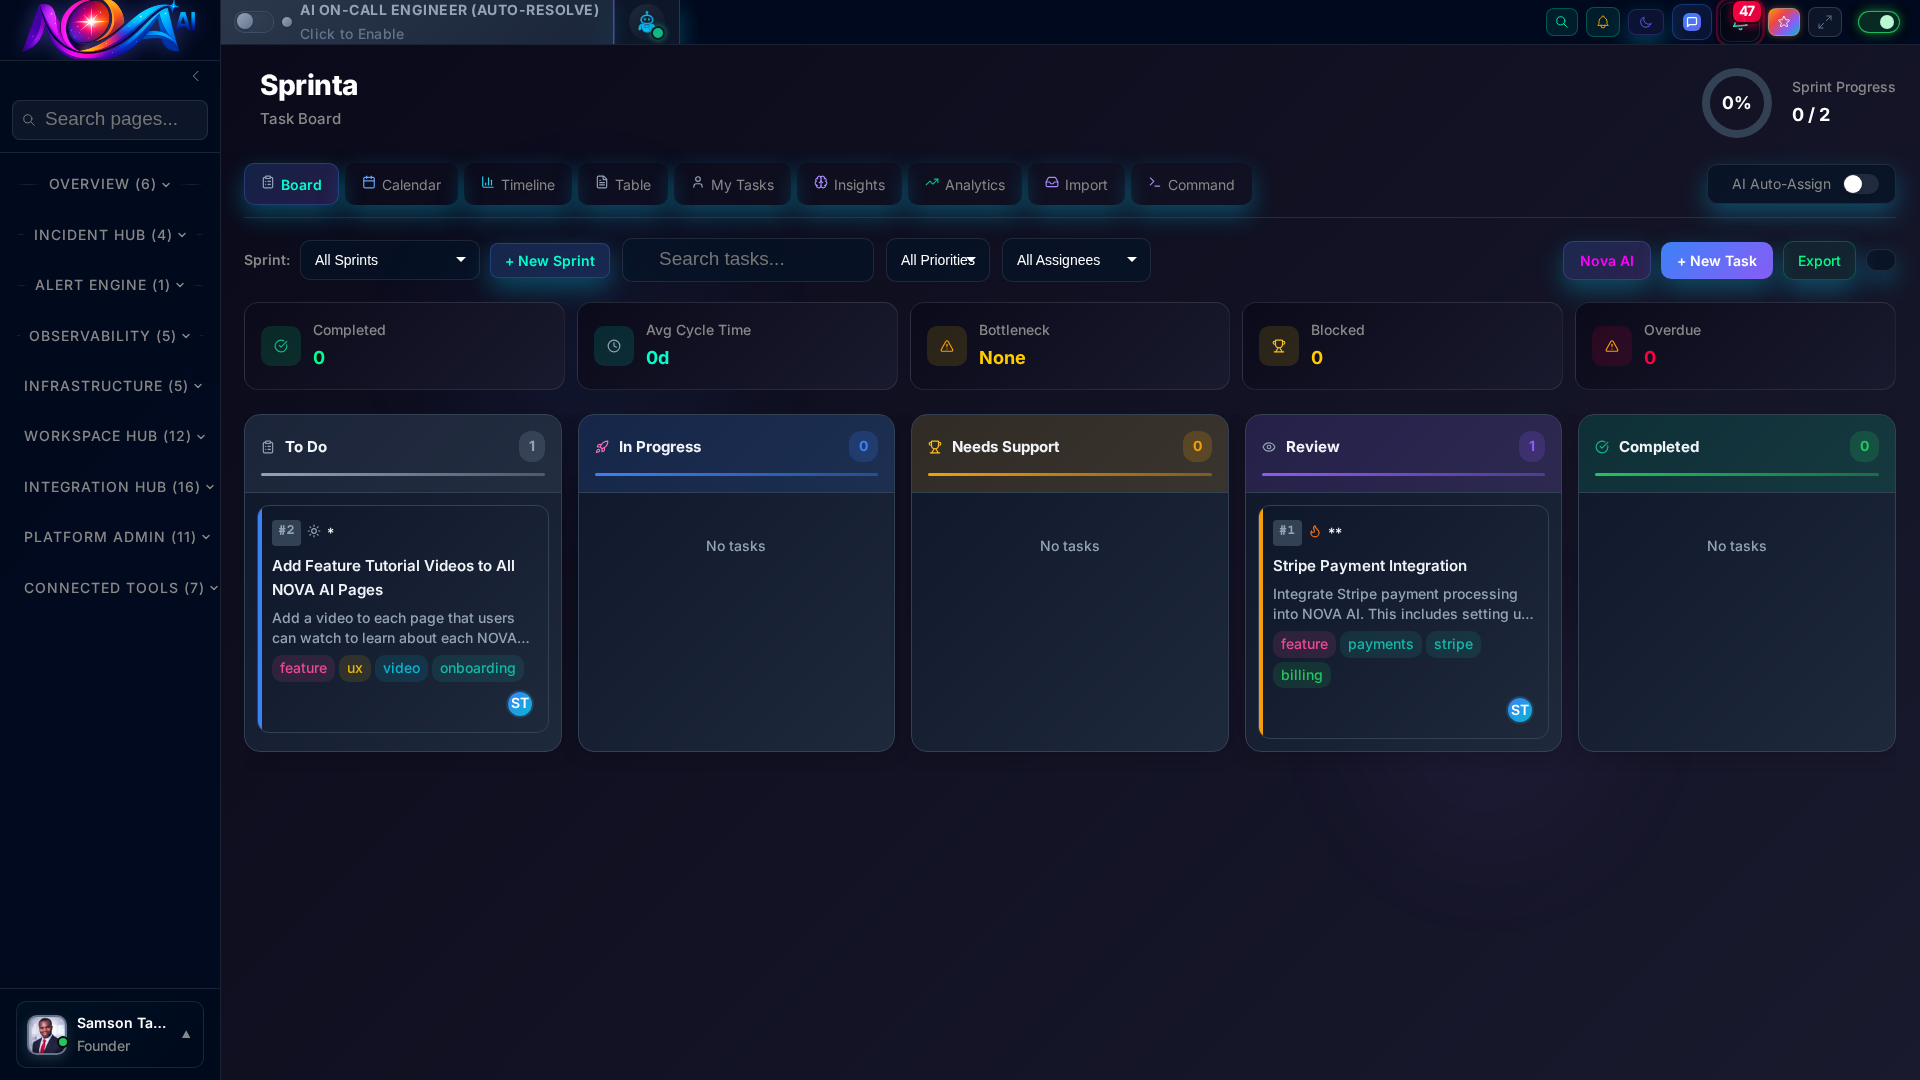 Sprint NexusSynthetic Monitoring
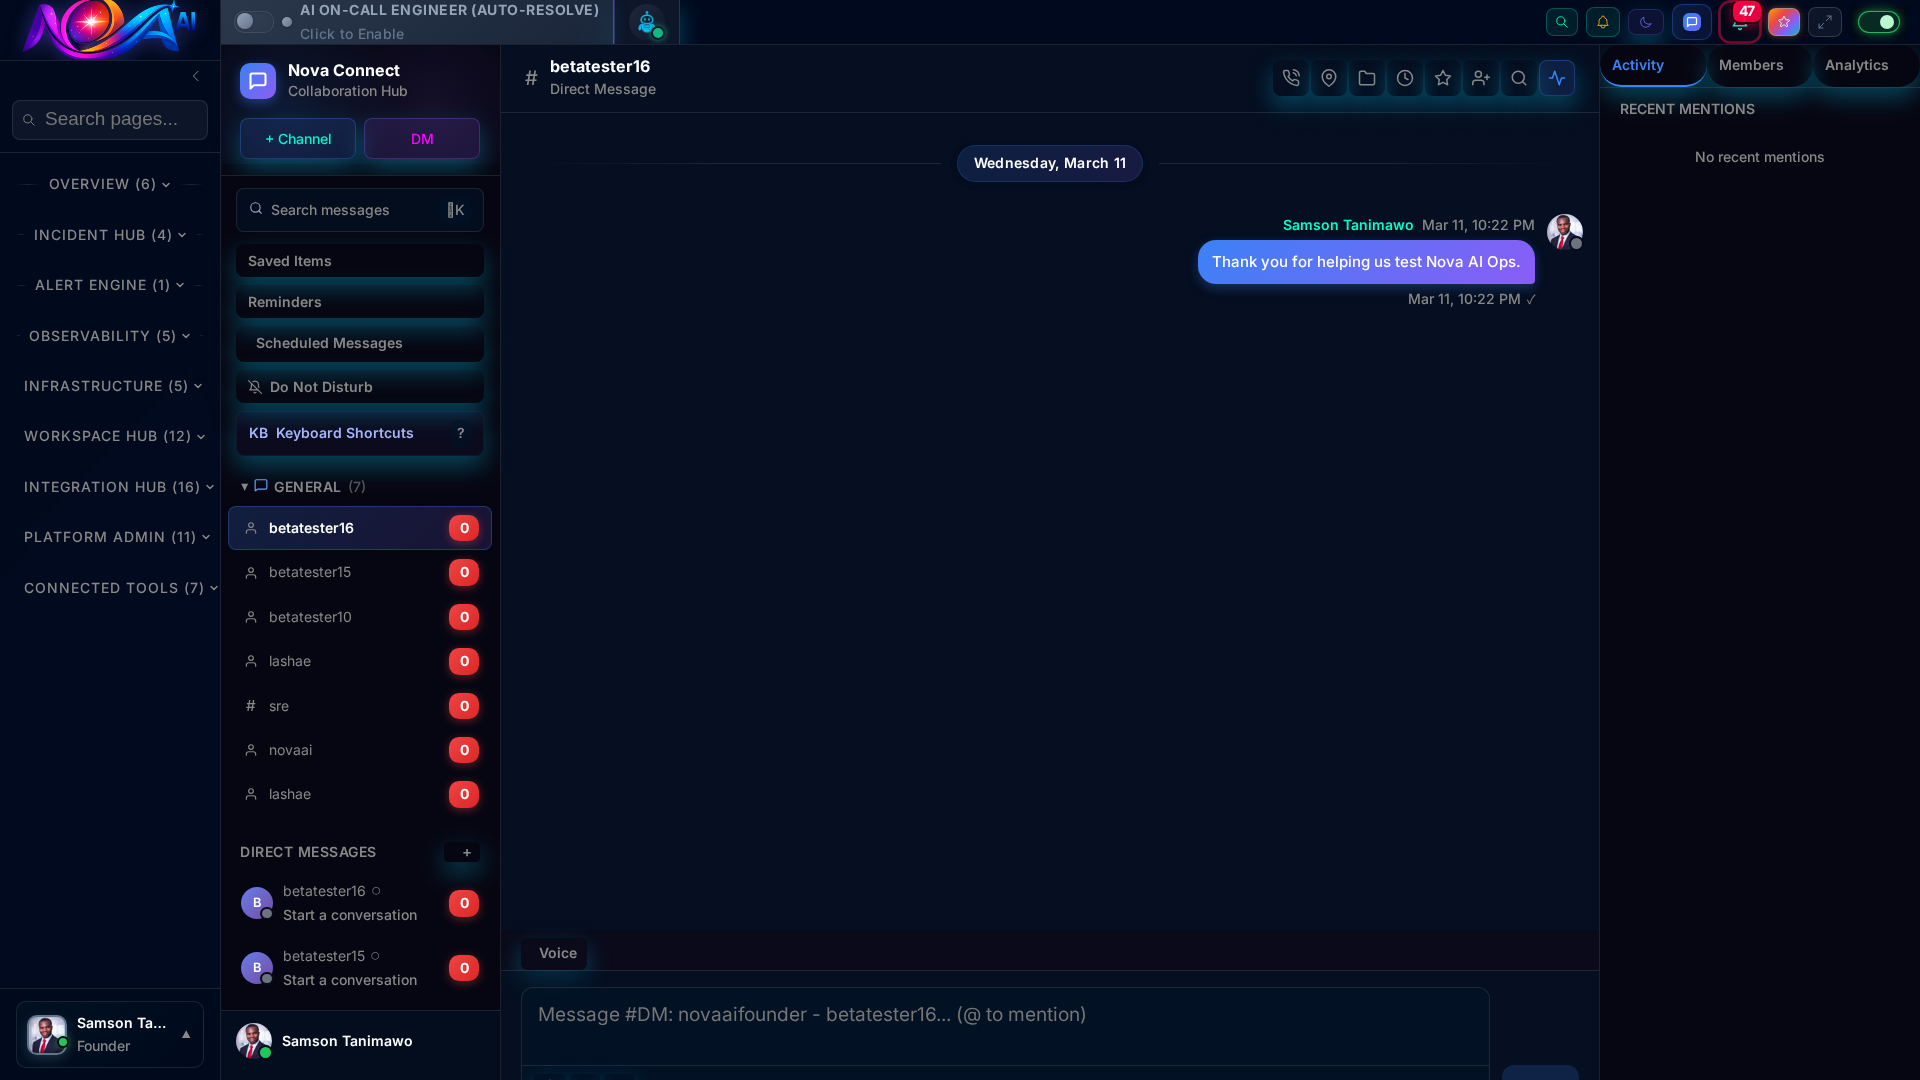 Nova Connect
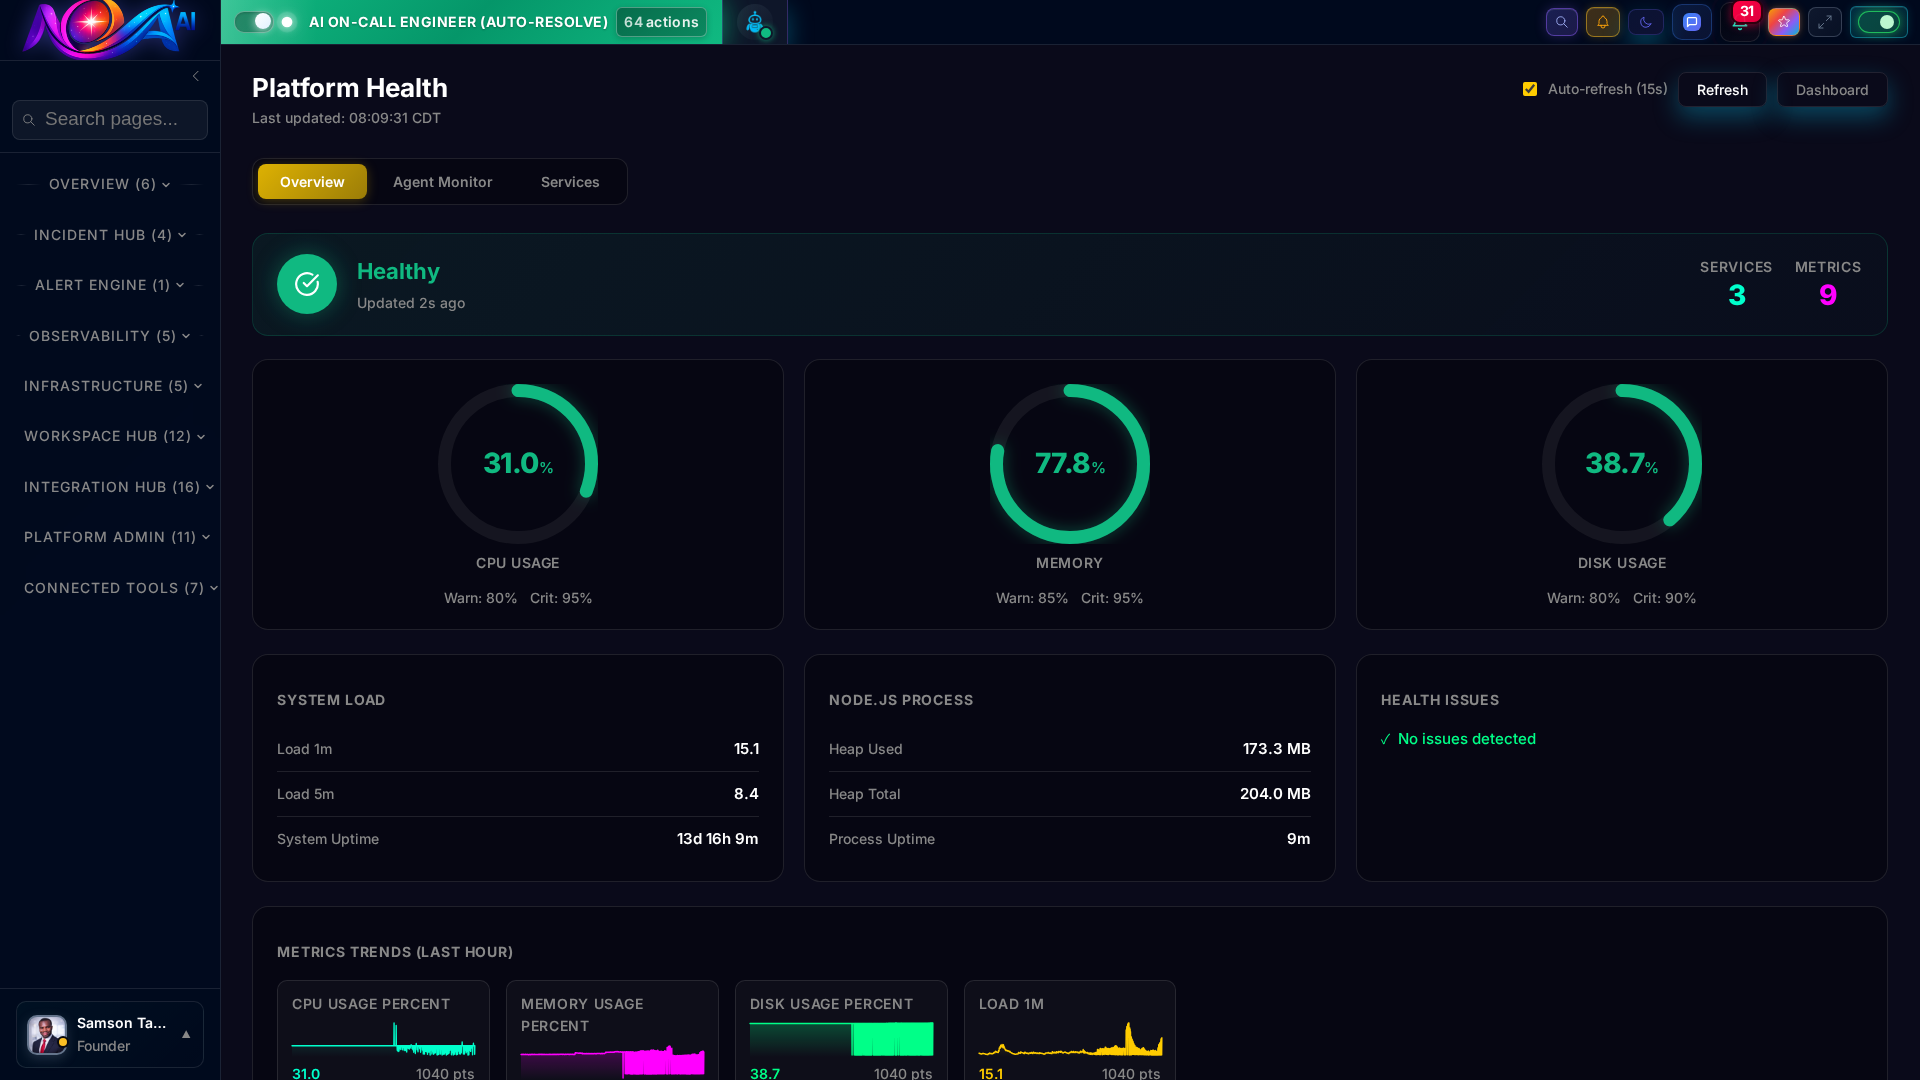 Platform HealthAI PostmortemPredictive DetectionApproval QueueNova ShellPerformance TrendsSession ReplaySystem OverviewReal-time DashboardAI Agent FleetGolden SignalsIncident TimelineNova TransferService CatalogOn-Call RosterAI RunbooksAgent LedgerDashboard StudioAI Team StatusLog ExplorerCertificate ManagerRequest TracingSecrets ManagerService MapSprint NexusSynthetic MonitoringNova ConnectPlatform HealthAI PostmortemPredictive DetectionApproval QueueNova ShellPerformance TrendsSession Replay
50+ native connectors. No custom code required. One-click setup for the tools you already use.
Start free. Upgrade when your infrastructure demands it. No surprises.
Datadog is metrics ingestion. PagerDuty is alert routing. Nova AI is an autonomous operations platform that combines observability, incident management, and AI-powered remediation in one. Our 101 AI agents don't just alert you to problems, they fix them automatically.
Most teams are up and running within 30 minutes. Install the Nova agent on your infrastructure, connect your existing tools via our one-click integrations, and the AI starts learning your patterns immediately. Full value is typically realized within the first week.
Absolutely. Nova AI is built with SOC-2 Type II and ISO-27001 compliance. All data is encrypted at rest (AES-256) and in transit (TLS 1.3). We support data residency requirements, role-based access control, and maintain full audit trails of every action.
You control the autonomy level. Low-risk, well-tested remediations (like restarting a healthy pod or scaling a service) can be fully automated. High-risk actions go through an approval queue where your team reviews and approves before execution. You set the boundaries.
Nova AI uses a multi-provider approach with automatic failover. We integrate with OpenAI (GPT-4o), Anthropic (Claude), Google (Gemini), Meta (LLaMA), and more. The system automatically selects the best model for each task and falls back to alternatives if needed.
No. Nova AI connects to your existing tools through 50+ native integrations. You can use Nova as your primary platform or as an intelligence layer on top of your current stack. Many teams start by connecting their existing tools and gradually consolidate.